29
/
en
AIzaSyAYiBZKx7MnpbEhh9jyipgxe19OcubqV5w
April 1, 2024
206341
Nepal
NPL
true
2
1
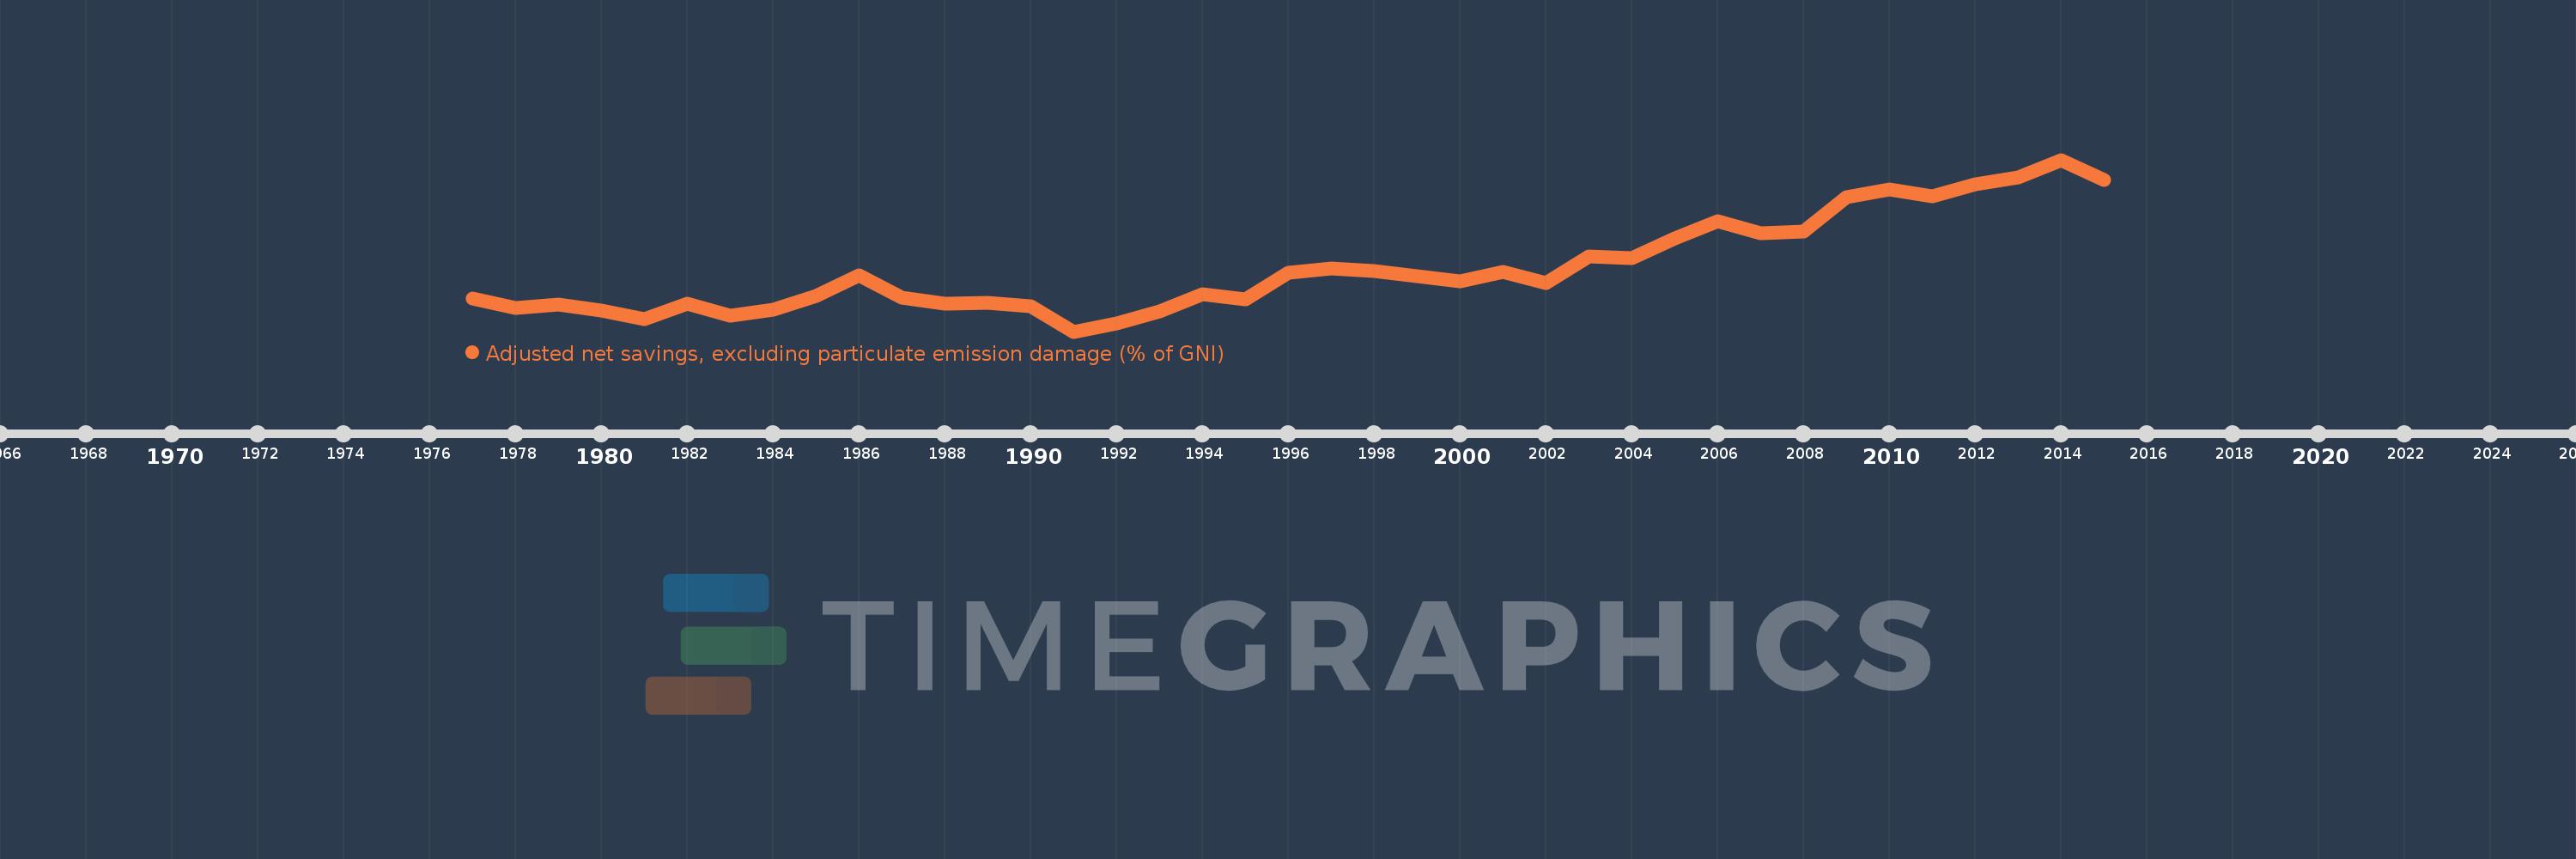
Adjusted net savings, excluding particulate emission damage (% of GNI)
2015,2014,2013,2012,2011,2010,2009,2008,2007,2006,2005,2004,2003,2002,2001,2000,1999,1998,1997,1996,1995,1994,1993,1992,1991,1990,1989,1988,1987,1986,1985,1984,1983,1982,1981,1980,1979,1978,1977
This statistics in other country:
AfghanistanAlbaniaAlgeriaAngolaArab WorldArgentinaArmeniaAustraliaAustriaAzerbaijanBahamas, TheBahrainBangladeshBarbadosBelarusBelgiumBelizeBeninBhutanBoliviaBotswanaBrazilBrunei DarussalamBulgariaBurkina FasoBurundiCabo VerdeCambodiaCameroonCanadaCaribbean small statesCentral African RepublicCentral Europe and the BalticsChadChileChinaColombiaComorosCongo, Dem. Rep.Congo, Rep.Costa RicaCote d'IvoireCroatiaCyprusCzech RepublicDenmarkDjiboutiDominicaDominican RepublicEarly-demographic dividendEast Asia & PacificEast Asia & Pacific (excluding high income)East Asia & Pacific (IDA & IBRD countries)EcuadorEgypt, Arab Rep.El SalvadorEquatorial GuineaEritreaEstoniaEthiopiaEuro areaEurope & Central AsiaEurope & Central Asia (excluding high income)Europe & Central Asia (IDA & IBRD countries)European UnionFijiFinlandFragile and conflict affected situationsFranceGabonGambia, TheGeorgiaGermanyGhanaGreeceGuatemalaGuineaGuinea-BissauGuyanaHaitiHeavily indebted poor countries (HIPC)High incomeHondurasHungaryIBRD onlyIcelandIDA & IBRD totalIDA blendIDA onlyIDA totalIndiaIndonesiaIran, Islamic Rep.IraqIrelandIsraelItalyJamaicaJapanJordanKazakhstanKenyaKiribatiKorea, Rep.KuwaitKyrgyz RepublicLao PDRLate-demographic dividendLatin America & Caribbean Latin America & Caribbean (excluding high income)Latin America & the Caribbean (IDA & IBRD countries)LatviaLeast developed countries: UN classificationLebanonLesothoLiberiaLibyaLithuaniaLow & middle incomeLow incomeLower middle incomeLuxembourgMacedonia, FYRMadagascarMalawiMalaysiaMaldivesMaliMauritaniaMauritiusMexicoMiddle East & North AfricaMiddle East & North Africa (excluding high income)Middle East & North Africa (IDA & IBRD countries)Middle incomeMoldovaMongoliaMoroccoMozambiqueNamibiaNepalNetherlandsNew ZealandNicaraguaNigerNigeriaNorth AmericaNorwayOECD membersOmanOther small statesPacific island small statesPakistanPanamaPapua New GuineaParaguayPeruPhilippinesPolandPortugalPost-demographic dividendPre-demographic dividendQatarRomaniaRussian FederationRwandaSaudi ArabiaSenegalSeychellesSierra LeoneSingaporeSlovak RepublicSloveniaSmall statesSolomon IslandsSouth AfricaSouth AsiaSouth Asia (IDA & IBRD)SpainSri LankaSt. LuciaSt. Vincent and the GrenadinesSub-Saharan Africa Sub-Saharan Africa (excluding high income)Sub-Saharan Africa (IDA & IBRD countries)SudanSurinameSwazilandSwedenSwitzerlandSyrian Arab RepublicTajikistanTanzaniaThailandTogoTongaTrinidad and TobagoTunisiaTurkeyUgandaUkraineUnited KingdomUnited StatesUpper middle incomeUruguayVanuatuVenezuela, RBVietnamWorldYemen, Rep.ZambiaZimbabwe Timeline:
This timeline shows a graph from 1977 to 2015 of Nepal. No data until 1976. Number of actual observations by date: 39.
Source name:
World Development Indicators
Source organization:
World Bank staff estimates based on sources and methods in World Bank's "The Changing Wealth of Nations: Measuring Sustainable Development in the New Millennium" (2011).
Categories, topics:
Economy & Growth, Environment
Last updated:
apr 23, 2017
Indicators value changes by year
Maximum:
37.408
jan 1, 2014
At the date of observation
Value
Absolute change
Change from previous value
jan 1, 1977
8.757
+8.757
0.0%
jan 1, 1978
6.906
-1.85
-21.13%
jan 1, 1979
7.694
+0.787
11.4%
jan 1, 1980
6.307
-1.386
-18.02%
jan 1, 1981
4.623
-1.684
-26.71%
jan 1, 1982
7.802
+3.179
68.77%
jan 1, 1983
5.306
-2.495
-31.98%
jan 1, 1984
6.606
+1.3
24.5%
jan 1, 1985
9.408
+2.801
42.4%
jan 1, 1986
13.578
+4.17
44.33%
jan 1, 1987
9.101
-4.477
-32.97%
jan 1, 1988
7.751
-1.35
-14.83%
jan 1, 1989
8.009
+0.258
3.33%
jan 1, 1990
7.223
-0.786
-9.81%
jan 1, 1991
2.035
-5.188
-71.83%
jan 1, 1992
3.777
+1.742
85.61%
jan 1, 1993
6.144
+2.367
62.66%
jan 1, 1994
9.668
+3.524
57.36%
jan 1, 1995
8.752
-0.916
-9.48%
jan 1, 1996
14.07
+5.318
60.77%
jan 1, 1997
14.989
+0.919
6.53%
jan 1, 1998
14.423
-0.567
-3.78%
jan 1, 1999
13.511
-0.911
-6.32%
jan 1, 2000
12.369
-1.143
-8.46%
jan 1, 2001
14.344
+1.975
15.97%
jan 1, 2002
11.951
-2.393
-16.68%
jan 1, 2003
17.477
+5.526
46.24%
jan 1, 2004
17.099
-0.378
-2.16%
jan 1, 2005
21.28
+4.18
24.45%
jan 1, 2006
24.759
+3.479
16.35%
jan 1, 2007
22.373
-2.386
-9.64%
jan 1, 2008
22.654
+0.281
1.26%
jan 1, 2009
29.777
+7.123
31.44%
jan 1, 2010
31.294
+1.517
5.09%
jan 1, 2011
29.932
-1.362
-4.35%
jan 1, 2012
32.44
+2.508
8.38%
jan 1, 2013
33.782
+1.342
4.14%
jan 1, 2014
37.408
+3.627
10.74%
jan 1, 2015
33.168
-4.24
-11.33%
Ranking of countries by current statistics by years


Comments: