29
/
en
AIzaSyAYiBZKx7MnpbEhh9jyipgxe19OcubqV5w
April 1, 2024
223121
Philippines
PHL
true
2
1
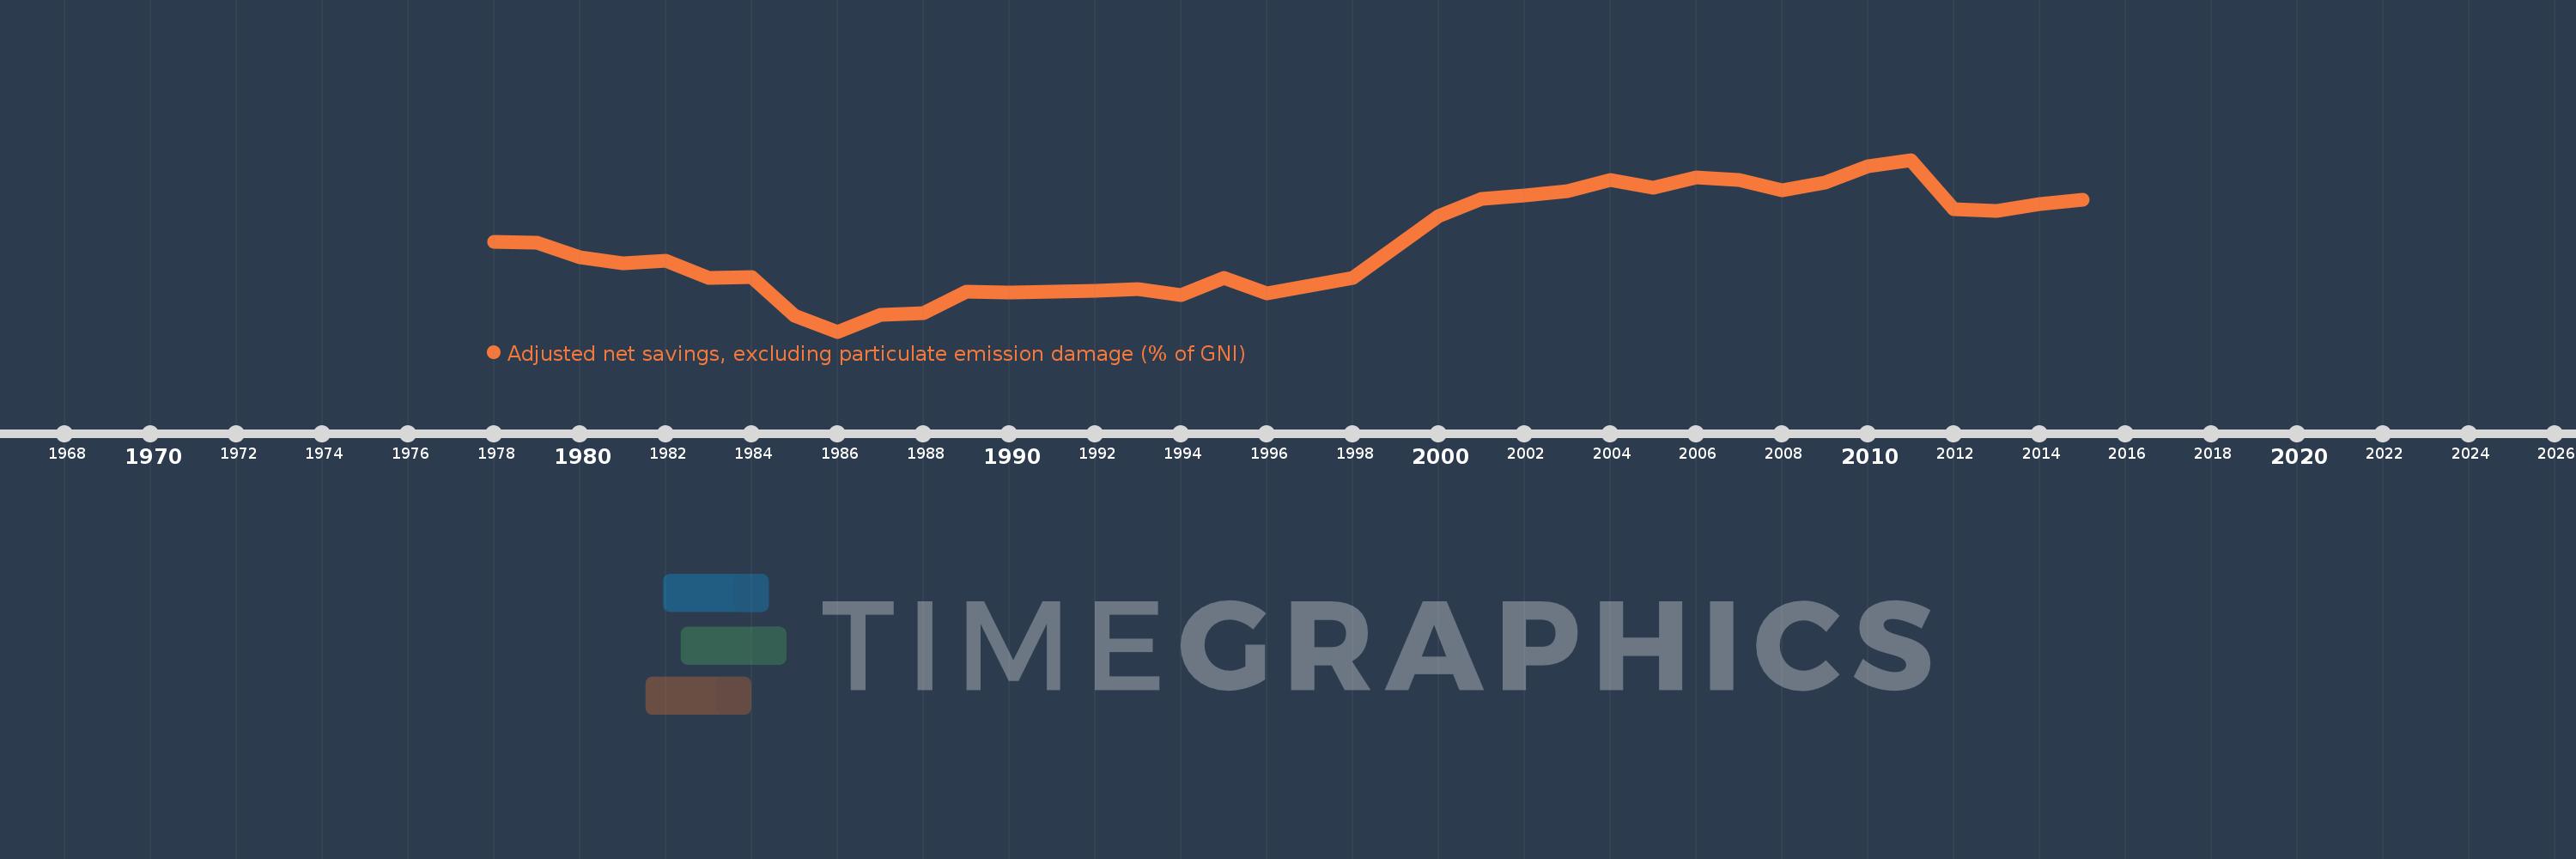
Adjusted net savings, excluding particulate emission damage (% of GNI)
2015,2014,2013,2012,2011,2010,2009,2008,2007,2006,2005,2004,2003,2002,2001,2000,1999,1998,1997,1996,1995,1994,1993,1992,1991,1990,1989,1988,1987,1986,1985,1984,1983,1982,1981,1980,1979,1978
This statistics in other country:
AfghanistanAlbaniaAlgeriaAngolaArab WorldArgentinaArmeniaAustraliaAustriaAzerbaijanBahamas, TheBahrainBangladeshBarbadosBelarusBelgiumBelizeBeninBhutanBoliviaBotswanaBrazilBrunei DarussalamBulgariaBurkina FasoBurundiCabo VerdeCambodiaCameroonCanadaCaribbean small statesCentral African RepublicCentral Europe and the BalticsChadChileChinaColombiaComorosCongo, Dem. Rep.Congo, Rep.Costa RicaCote d'IvoireCroatiaCyprusCzech RepublicDenmarkDjiboutiDominicaDominican RepublicEarly-demographic dividendEast Asia & PacificEast Asia & Pacific (excluding high income)East Asia & Pacific (IDA & IBRD countries)EcuadorEgypt, Arab Rep.El SalvadorEquatorial GuineaEritreaEstoniaEthiopiaEuro areaEurope & Central AsiaEurope & Central Asia (excluding high income)Europe & Central Asia (IDA & IBRD countries)European UnionFijiFinlandFragile and conflict affected situationsFranceGabonGambia, TheGeorgiaGermanyGhanaGreeceGuatemalaGuineaGuinea-BissauGuyanaHaitiHeavily indebted poor countries (HIPC)High incomeHondurasHungaryIBRD onlyIcelandIDA & IBRD totalIDA blendIDA onlyIDA totalIndiaIndonesiaIran, Islamic Rep.IraqIrelandIsraelItalyJamaicaJapanJordanKazakhstanKenyaKiribatiKorea, Rep.KuwaitKyrgyz RepublicLao PDRLate-demographic dividendLatin America & Caribbean Latin America & Caribbean (excluding high income)Latin America & the Caribbean (IDA & IBRD countries)LatviaLeast developed countries: UN classificationLebanonLesothoLiberiaLibyaLithuaniaLow & middle incomeLow incomeLower middle incomeLuxembourgMacedonia, FYRMadagascarMalawiMalaysiaMaldivesMaliMauritaniaMauritiusMexicoMiddle East & North AfricaMiddle East & North Africa (excluding high income)Middle East & North Africa (IDA & IBRD countries)Middle incomeMoldovaMongoliaMoroccoMozambiqueNamibiaNepalNetherlandsNew ZealandNicaraguaNigerNigeriaNorth AmericaNorwayOECD membersOmanOther small statesPacific island small statesPakistanPanamaPapua New GuineaParaguayPeruPhilippinesPolandPortugalPost-demographic dividendPre-demographic dividendQatarRomaniaRussian FederationRwandaSaudi ArabiaSenegalSeychellesSierra LeoneSingaporeSlovak RepublicSloveniaSmall statesSolomon IslandsSouth AfricaSouth AsiaSouth Asia (IDA & IBRD)SpainSri LankaSt. LuciaSt. Vincent and the GrenadinesSub-Saharan Africa Sub-Saharan Africa (excluding high income)Sub-Saharan Africa (IDA & IBRD countries)SudanSurinameSwazilandSwedenSwitzerlandSyrian Arab RepublicTajikistanTanzaniaThailandTogoTongaTrinidad and TobagoTunisiaTurkeyUgandaUkraineUnited KingdomUnited StatesUpper middle incomeUruguayVanuatuVenezuela, RBVietnamWorldYemen, Rep.ZambiaZimbabwe Timeline:
This timeline shows a graph from 1978 to 2015 of Philippines. No data until 1977. Number of actual observations by date: 38.
Source name:
World Development Indicators
Source organization:
World Bank staff estimates based on sources and methods in World Bank's "The Changing Wealth of Nations: Measuring Sustainable Development in the New Millennium" (2011).
Categories, topics:
Economy & Growth, Environment
Last updated:
apr 23, 2017
Indicators value changes by year
Maximum:
36.889
jan 1, 2011
At the date of observation
Value
Absolute change
Change from previous value
jan 1, 1978
21.008
+21.008
0.0%
jan 1, 1979
20.786
-0.222
-1.06%
jan 1, 1980
17.977
-2.809
-13.51%
jan 1, 1981
16.714
-1.263
-7.03%
jan 1, 1982
17.329
+0.615
3.68%
jan 1, 1983
13.973
-3.356
-19.37%
jan 1, 1984
14.046
+0.073
0.52%
jan 1, 1985
6.664
-7.382
-52.55%
jan 1, 1986
3.494
-3.17
-47.57%
jan 1, 1987
6.771
+3.276
93.75%
jan 1, 1988
7.136
+0.365
5.39%
jan 1, 1989
11.24
+4.105
57.52%
jan 1, 1990
11.042
-0.199
-1.77%
jan 1, 1991
11.325
+0.283
2.57%
jan 1, 1992
11.49
+0.165
1.45%
jan 1, 1993
11.745
+0.256
2.23%
jan 1, 1994
10.525
-1.22
-10.39%
jan 1, 1995
13.89
+3.365
31.97%
jan 1, 1996
10.885
-3.004
-21.63%
jan 1, 1997
12.389
+1.504
13.81%
jan 1, 1998
14.009
+1.62
13.08%
jan 1, 1999
19.88
+5.871
41.91%
jan 1, 2000
26.034
+6.154
30.95%
jan 1, 2001
29.303
+3.269
12.56%
jan 1, 2002
30.043
+0.739
2.52%
jan 1, 2003
30.76
+0.717
2.39%
jan 1, 2004
32.985
+2.225
7.23%
jan 1, 2005
31.447
-1.538
-4.66%
jan 1, 2006
33.456
+2.008
6.39%
jan 1, 2007
32.935
-0.52
-1.56%
jan 1, 2008
30.93
-2.005
-6.09%
jan 1, 2009
32.449
+1.518
4.91%
jan 1, 2010
35.659
+3.21
9.89%
jan 1, 2011
36.889
+1.23
3.45%
jan 1, 2012
27.324
-9.564
-25.93%
jan 1, 2013
26.94
-0.384
-1.4%
jan 1, 2014
28.238
+1.297
4.82%
jan 1, 2015
29.134
+0.896
3.17%
Ranking of countries by current statistics by years


Comments: