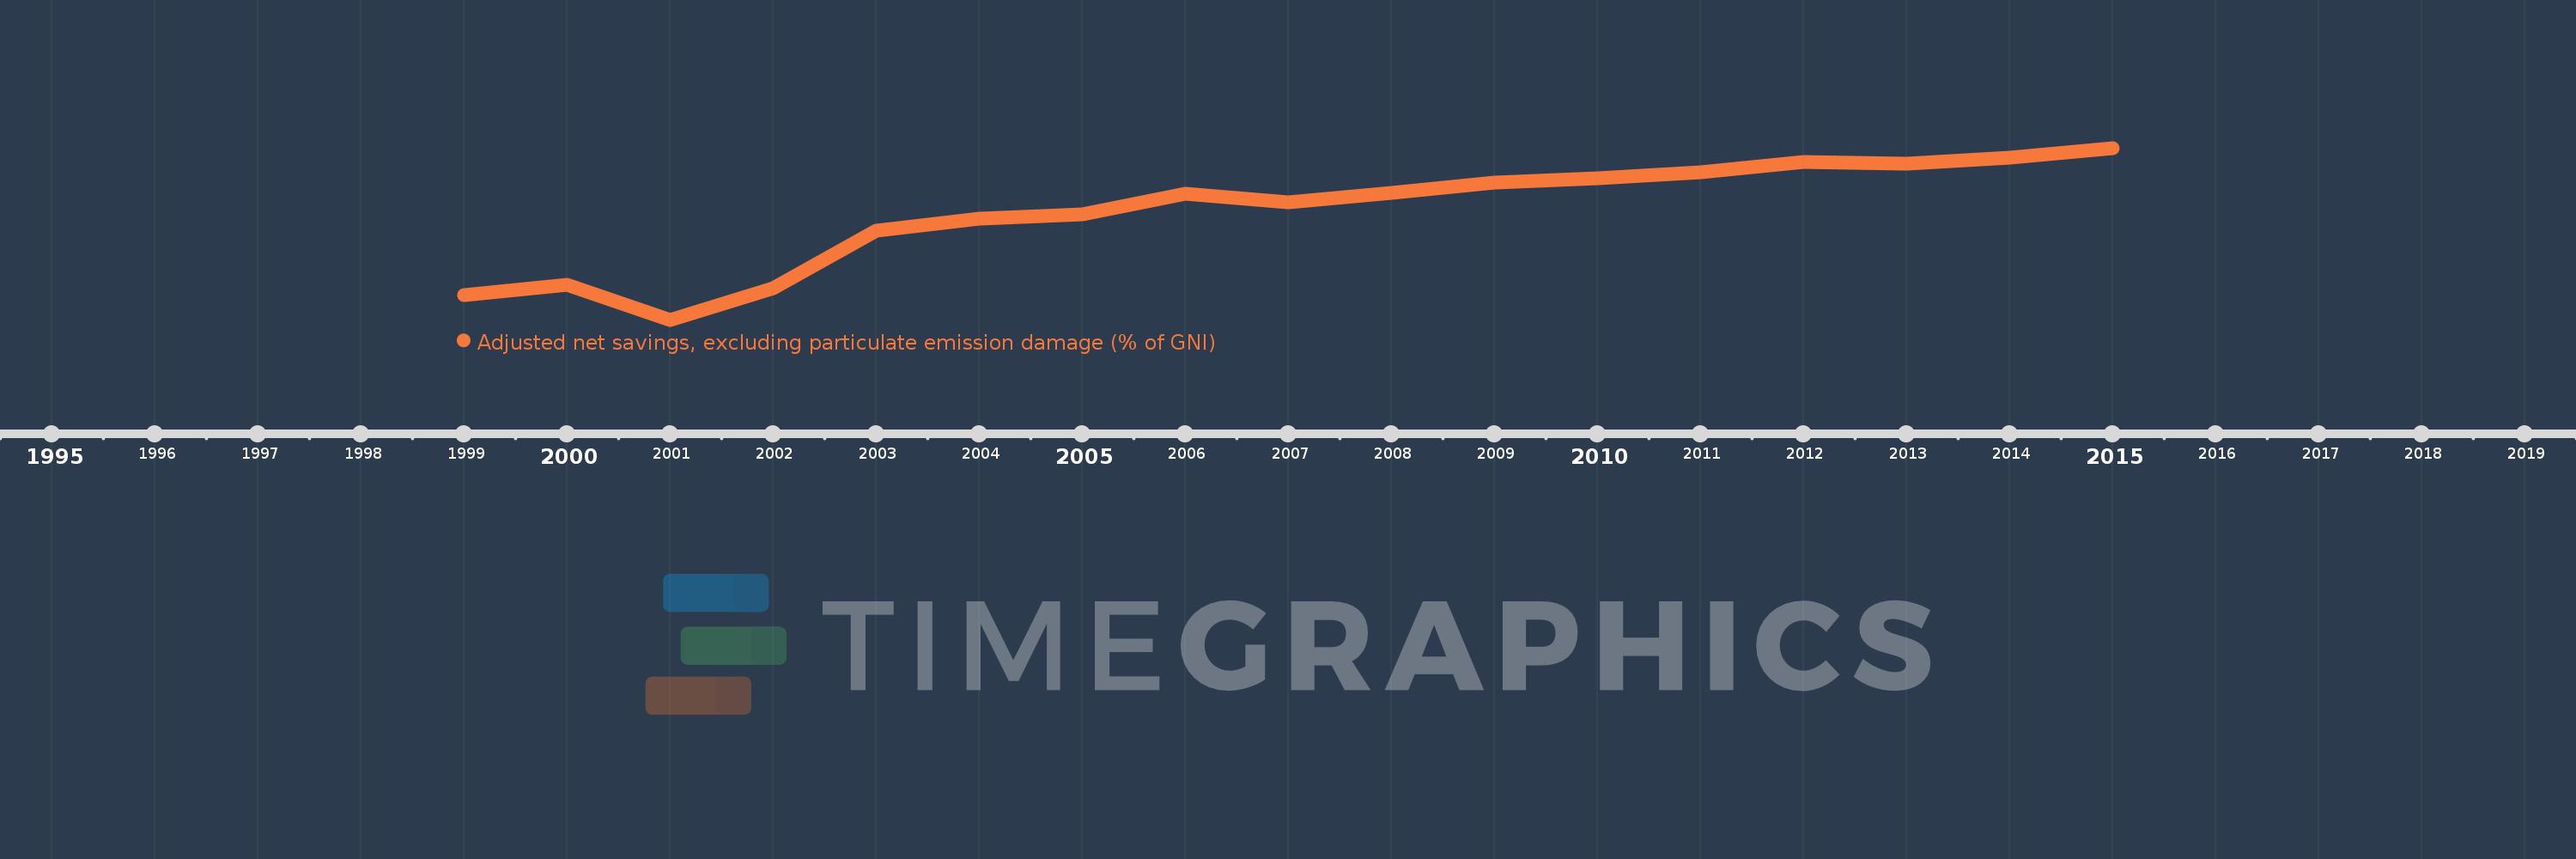
This timeline shows a graph from 1999 to 2015 of Azerbaijan. No data until 1998. Number of actual observations by date: 17.
Source name:
World Development Indicators
Source organization:
World Bank staff estimates based on sources and methods in World Bank's "The Changing Wealth of Nations: Measuring Sustainable Development in the New Millennium" (2011).
Categories, topics:
Economy & Growth, Environment
Last updated:
apr 23, 2017
Indicators value changes by year
Meaning:
-2.923
Minimum:
-38.197
jan 1, 2001
Maximum:
18.062
jan 1, 2015
At the date of observation
Value
Absolute change
Change from the previous value
jan 1, 1999
-30.219
-30.219
0.0%
jan 1, 2000
-26.875
+3.344
-11.07%
jan 1, 2001
-38.197
-11.322
42.13%
jan 1, 2002
-27.803
+10.394
-27.21%
jan 1, 2003
-8.932
+18.871
-67.87%
jan 1, 2004
-5.036
+3.896
-43.62%
jan 1, 2005
-3.55
+1.486
-29.51%
jan 1, 2006
3.031
+6.58
-185.38%
jan 1, 2007
0.349
-2.681
-88.48%
jan 1, 2008
3.46
+3.11
890.54%
jan 1, 2009
6.682
+3.222
93.13%
jan 1, 2010
7.995
+1.313
19.66%
jan 1, 2011
10.118
+2.123
26.55%
jan 1, 2012
13.396
+3.277
32.39%
jan 1, 2013
13.03
-0.366
-2.73%
jan 1, 2014
14.804
+1.774
13.62%
jan 1, 2015
18.062
+3.258
22.01%
Ranking of countries by current statistics by years
