29
/
en
AIzaSyAYiBZKx7MnpbEhh9jyipgxe19OcubqV5w
April 1, 2024
110534
Congo, Rep.
COG
true
2
1
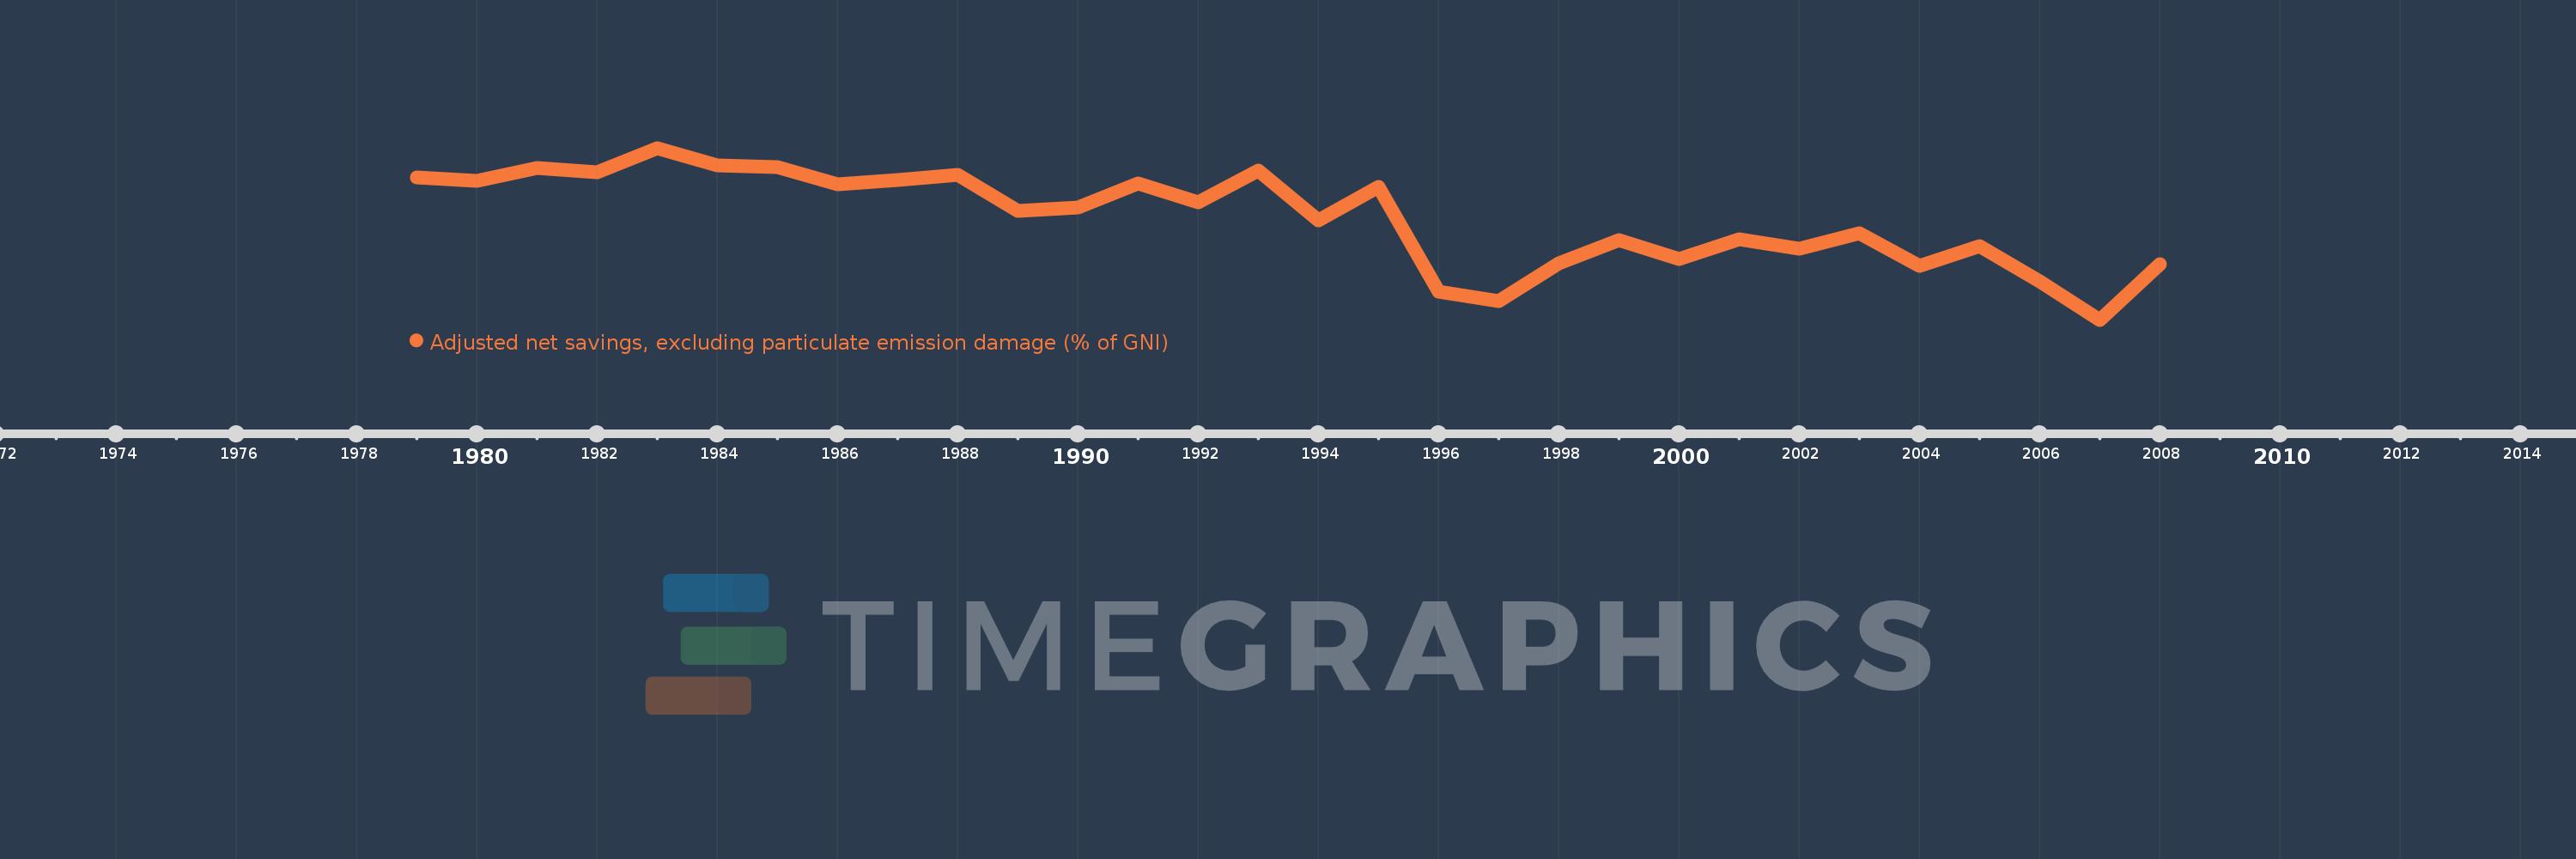
Adjusted net savings, excluding particulate emission damage (% of GNI)
2008,2007,2006,2005,2004,2003,2002,2001,2000,1999,1998,1997,1996,1995,1994,1993,1992,1991,1990,1989,1988,1987,1986,1985,1984,1983,1982,1981,1980,1979
This statistics in other country:
AfghanistanAlbaniaAlgeriaAngolaArab WorldArgentinaArmeniaAustraliaAustriaAzerbaijanBahamas, TheBahrainBangladeshBarbadosBelarusBelgiumBelizeBeninBhutanBoliviaBotswanaBrazilBrunei DarussalamBulgariaBurkina FasoBurundiCabo VerdeCambodiaCameroonCanadaCaribbean small statesCentral African RepublicCentral Europe and the BalticsChadChileChinaColombiaComorosCongo, Dem. Rep.Congo, Rep.Costa RicaCote d'IvoireCroatiaCyprusCzech RepublicDenmarkDjiboutiDominicaDominican RepublicEarly-demographic dividendEast Asia & PacificEast Asia & Pacific (excluding high income)East Asia & Pacific (IDA & IBRD countries)EcuadorEgypt, Arab Rep.El SalvadorEquatorial GuineaEritreaEstoniaEthiopiaEuro areaEurope & Central AsiaEurope & Central Asia (excluding high income)Europe & Central Asia (IDA & IBRD countries)European UnionFijiFinlandFragile and conflict affected situationsFranceGabonGambia, TheGeorgiaGermanyGhanaGreeceGuatemalaGuineaGuinea-BissauGuyanaHaitiHeavily indebted poor countries (HIPC)High incomeHondurasHungaryIBRD onlyIcelandIDA & IBRD totalIDA blendIDA onlyIDA totalIndiaIndonesiaIran, Islamic Rep.IraqIrelandIsraelItalyJamaicaJapanJordanKazakhstanKenyaKiribatiKorea, Rep.KuwaitKyrgyz RepublicLao PDRLate-demographic dividendLatin America & Caribbean Latin America & Caribbean (excluding high income)Latin America & the Caribbean (IDA & IBRD countries)LatviaLeast developed countries: UN classificationLebanonLesothoLiberiaLibyaLithuaniaLow & middle incomeLow incomeLower middle incomeLuxembourgMacedonia, FYRMadagascarMalawiMalaysiaMaldivesMaliMauritaniaMauritiusMexicoMiddle East & North AfricaMiddle East & North Africa (excluding high income)Middle East & North Africa (IDA & IBRD countries)Middle incomeMoldovaMongoliaMoroccoMozambiqueNamibiaNepalNetherlandsNew ZealandNicaraguaNigerNigeriaNorth AmericaNorwayOECD membersOmanOther small statesPacific island small statesPakistanPanamaPapua New GuineaParaguayPeruPhilippinesPolandPortugalPost-demographic dividendPre-demographic dividendQatarRomaniaRussian FederationRwandaSaudi ArabiaSenegalSeychellesSierra LeoneSingaporeSlovak RepublicSloveniaSmall statesSolomon IslandsSouth AfricaSouth AsiaSouth Asia (IDA & IBRD)SpainSri LankaSt. LuciaSt. Vincent and the GrenadinesSub-Saharan Africa Sub-Saharan Africa (excluding high income)Sub-Saharan Africa (IDA & IBRD countries)SudanSurinameSwazilandSwedenSwitzerlandSyrian Arab RepublicTajikistanTanzaniaThailandTogoTongaTrinidad and TobagoTunisiaTurkeyUgandaUkraineUnited KingdomUnited StatesUpper middle incomeUruguayVanuatuVenezuela, RBVietnamWorldYemen, Rep.ZambiaZimbabwe Timeline:
This timeline shows a graph from 1979 to 2008 of Congo, Rep.. No data until 1978. Number of actual observations by date: 30.
Source name:
World Development Indicators
Source organization:
World Bank staff estimates based on sources and methods in World Bank's "The Changing Wealth of Nations: Measuring Sustainable Development in the New Millennium" (2011).
Categories, topics:
Economy & Growth, Environment
Last updated:
apr 23, 2017
Indicators value changes by year
Minimum:
-102.186
jan 1, 2007
At the date of observation
Value
Absolute change
Change from previous value
jan 1, 1979
-16.017
-16.017
0.0%
jan 1, 1980
-17.925
-1.908
11.91%
jan 1, 1981
-9.901
+8.024
-44.76%
jan 1, 1982
-12.626
-2.725
27.52%
jan 1, 1983
2.067
+14.693
-116.37%
jan 1, 1984
-8.329
-10.396
-502.88%
jan 1, 1985
-9.548
-1.22
14.64%
jan 1, 1986
-19.83
-10.282
107.68%
jan 1, 1987
-17.222
+2.608
-13.15%
jan 1, 1988
-14.031
+3.191
-18.53%
jan 1, 1989
-35.951
-21.92
156.23%
jan 1, 1990
-33.943
+2.009
-5.59%
jan 1, 1991
-19.368
+14.574
-42.94%
jan 1, 1992
-31.123
-11.755
60.69%
jan 1, 1993
-11.825
+19.297
-62.0%
jan 1, 1994
-42.079
-30.254
255.84%
jan 1, 1995
-21.448
+20.631
-49.03%
jan 1, 1996
-85.168
-63.72
297.1%
jan 1, 1997
-90.929
-5.761
6.76%
jan 1, 1998
-67.841
+23.088
-25.39%
jan 1, 1999
-54.096
+13.745
-20.26%
jan 1, 2000
-65.567
-11.472
21.21%
jan 1, 2001
-53.549
+12.018
-18.33%
jan 1, 2002
-58.91
-5.362
10.01%
jan 1, 2003
-49.48
+9.43
-16.01%
jan 1, 2004
-69.62
-20.14
40.7%
jan 1, 2005
-57.548
+12.072
-17.34%
jan 1, 2006
-78.685
-21.137
36.73%
jan 1, 2007
-102.186
-23.501
29.87%
jan 1, 2008
-68.398
+33.788
-33.07%
Ranking of countries by current statistics by years


Comments: