29
/
en
AIzaSyAYiBZKx7MnpbEhh9jyipgxe19OcubqV5w
April 1, 2024
167052
Kenya
KEN
true
2
1
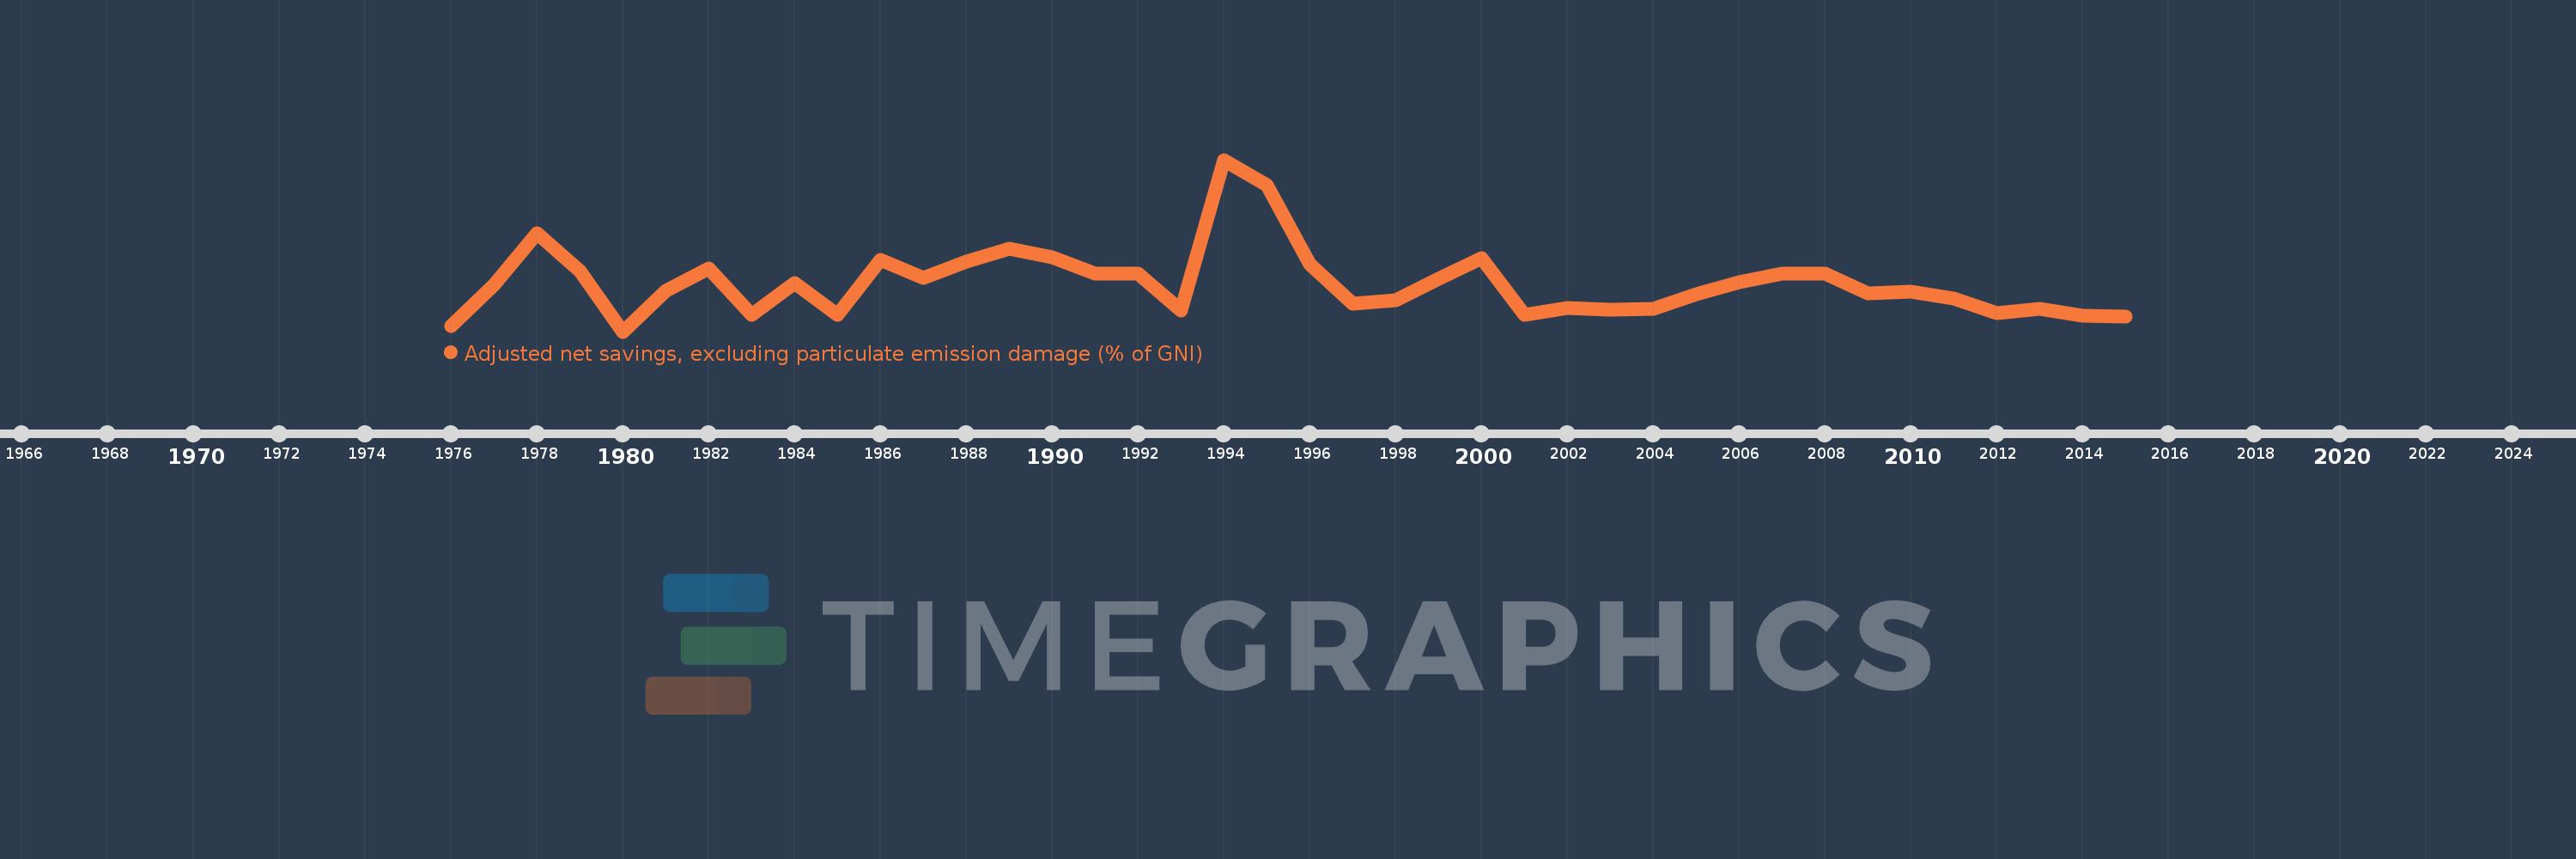
Adjusted net savings, excluding particulate emission damage (% of GNI)
2015,2014,2013,2012,2011,2010,2009,2008,2007,2006,2005,2004,2003,2002,2001,2000,1999,1998,1997,1996,1995,1994,1993,1992,1991,1990,1989,1988,1987,1986,1985,1984,1983,1982,1981,1980,1979,1978,1977,1976
This statistics in other country:
AfghanistanAlbaniaAlgeriaAngolaArab WorldArgentinaArmeniaAustraliaAustriaAzerbaijanBahamas, TheBahrainBangladeshBarbadosBelarusBelgiumBelizeBeninBhutanBoliviaBotswanaBrazilBrunei DarussalamBulgariaBurkina FasoBurundiCabo VerdeCambodiaCameroonCanadaCaribbean small statesCentral African RepublicCentral Europe and the BalticsChadChileChinaColombiaComorosCongo, Dem. Rep.Congo, Rep.Costa RicaCote d'IvoireCroatiaCyprusCzech RepublicDenmarkDjiboutiDominicaDominican RepublicEarly-demographic dividendEast Asia & PacificEast Asia & Pacific (excluding high income)East Asia & Pacific (IDA & IBRD countries)EcuadorEgypt, Arab Rep.El SalvadorEquatorial GuineaEritreaEstoniaEthiopiaEuro areaEurope & Central AsiaEurope & Central Asia (excluding high income)Europe & Central Asia (IDA & IBRD countries)European UnionFijiFinlandFragile and conflict affected situationsFranceGabonGambia, TheGeorgiaGermanyGhanaGreeceGuatemalaGuineaGuinea-BissauGuyanaHaitiHeavily indebted poor countries (HIPC)High incomeHondurasHungaryIBRD onlyIcelandIDA & IBRD totalIDA blendIDA onlyIDA totalIndiaIndonesiaIran, Islamic Rep.IraqIrelandIsraelItalyJamaicaJapanJordanKazakhstanKenyaKiribatiKorea, Rep.KuwaitKyrgyz RepublicLao PDRLate-demographic dividendLatin America & Caribbean Latin America & Caribbean (excluding high income)Latin America & the Caribbean (IDA & IBRD countries)LatviaLeast developed countries: UN classificationLebanonLesothoLiberiaLibyaLithuaniaLow & middle incomeLow incomeLower middle incomeLuxembourgMacedonia, FYRMadagascarMalawiMalaysiaMaldivesMaliMauritaniaMauritiusMexicoMiddle East & North AfricaMiddle East & North Africa (excluding high income)Middle East & North Africa (IDA & IBRD countries)Middle incomeMoldovaMongoliaMoroccoMozambiqueNamibiaNepalNetherlandsNew ZealandNicaraguaNigerNigeriaNorth AmericaNorwayOECD membersOmanOther small statesPacific island small statesPakistanPanamaPapua New GuineaParaguayPeruPhilippinesPolandPortugalPost-demographic dividendPre-demographic dividendQatarRomaniaRussian FederationRwandaSaudi ArabiaSenegalSeychellesSierra LeoneSingaporeSlovak RepublicSloveniaSmall statesSolomon IslandsSouth AfricaSouth AsiaSouth Asia (IDA & IBRD)SpainSri LankaSt. LuciaSt. Vincent and the GrenadinesSub-Saharan Africa Sub-Saharan Africa (excluding high income)Sub-Saharan Africa (IDA & IBRD countries)SudanSurinameSwazilandSwedenSwitzerlandSyrian Arab RepublicTajikistanTanzaniaThailandTogoTongaTrinidad and TobagoTunisiaTurkeyUgandaUkraineUnited KingdomUnited StatesUpper middle incomeUruguayVanuatuVenezuela, RBVietnamWorldYemen, Rep.ZambiaZimbabwe Timeline:
This timeline shows a graph from 1976 to 2015 of Kenya. No data until 1975. Number of actual observations by date: 40.
Source name:
World Development Indicators
Source organization:
World Bank staff estimates based on sources and methods in World Bank's "The Changing Wealth of Nations: Measuring Sustainable Development in the New Millennium" (2011).
Categories, topics:
Economy & Growth, Environment
Last updated:
apr 23, 2017
Indicators value changes by year
Maximum:
28.386
jan 1, 1994
At the date of observation
Value
Absolute change
Change from previous value
jan 1, 1976
3.594
+3.594
0.0%
jan 1, 1977
9.73
+6.136
170.71%
jan 1, 1978
17.423
+7.693
79.06%
jan 1, 1979
11.801
-5.622
-32.27%
jan 1, 1980
2.825
-8.976
-76.06%
jan 1, 1981
8.95
+6.125
216.83%
jan 1, 1982
12.281
+3.331
37.21%
jan 1, 1983
5.305
-6.976
-56.8%
jan 1, 1984
10.066
+4.76
89.73%
jan 1, 1985
5.377
-4.688
-46.58%
jan 1, 1986
13.507
+8.13
151.19%
jan 1, 1987
10.793
-2.714
-20.09%
jan 1, 1988
13.258
+2.465
22.83%
jan 1, 1989
15.22
+1.962
14.8%
jan 1, 1990
13.926
-1.294
-8.5%
jan 1, 1991
11.465
-2.461
-17.67%
jan 1, 1992
11.51
+0.044
0.39%
jan 1, 1993
5.952
-5.558
-48.29%
jan 1, 1994
28.386
+22.433
376.89%
jan 1, 1995
24.602
-3.783
-13.33%
jan 1, 1996
12.858
-11.745
-47.74%
jan 1, 1997
6.932
-5.926
-46.09%
jan 1, 1998
7.45
+0.518
7.47%
jan 1, 1999
10.733
+3.284
44.08%
jan 1, 2000
13.782
+3.049
28.41%
jan 1, 2001
5.304
-8.478
-61.51%
jan 1, 2002
6.296
+0.991
18.69%
jan 1, 2003
6.12
-0.175
-2.78%
jan 1, 2004
6.233
+0.113
1.84%
jan 1, 2005
8.442
+2.209
35.44%
jan 1, 2006
10.22
+1.777
21.05%
jan 1, 2007
11.508
+1.288
12.6%
jan 1, 2008
11.451
-0.057
-0.49%
jan 1, 2009
8.546
-2.905
-25.37%
jan 1, 2010
8.779
+0.233
2.72%
jan 1, 2011
7.805
-0.974
-11.09%
jan 1, 2012
5.636
-2.169
-27.79%
jan 1, 2013
6.191
+0.556
9.86%
jan 1, 2014
5.223
-0.969
-15.65%
jan 1, 2015
5.01
-0.213
-4.08%
Ranking of countries by current statistics by years


Comments: