29
/
en
AIzaSyAYiBZKx7MnpbEhh9jyipgxe19OcubqV5w
April 1, 2024
264171
Togo
TGO
true
2
1
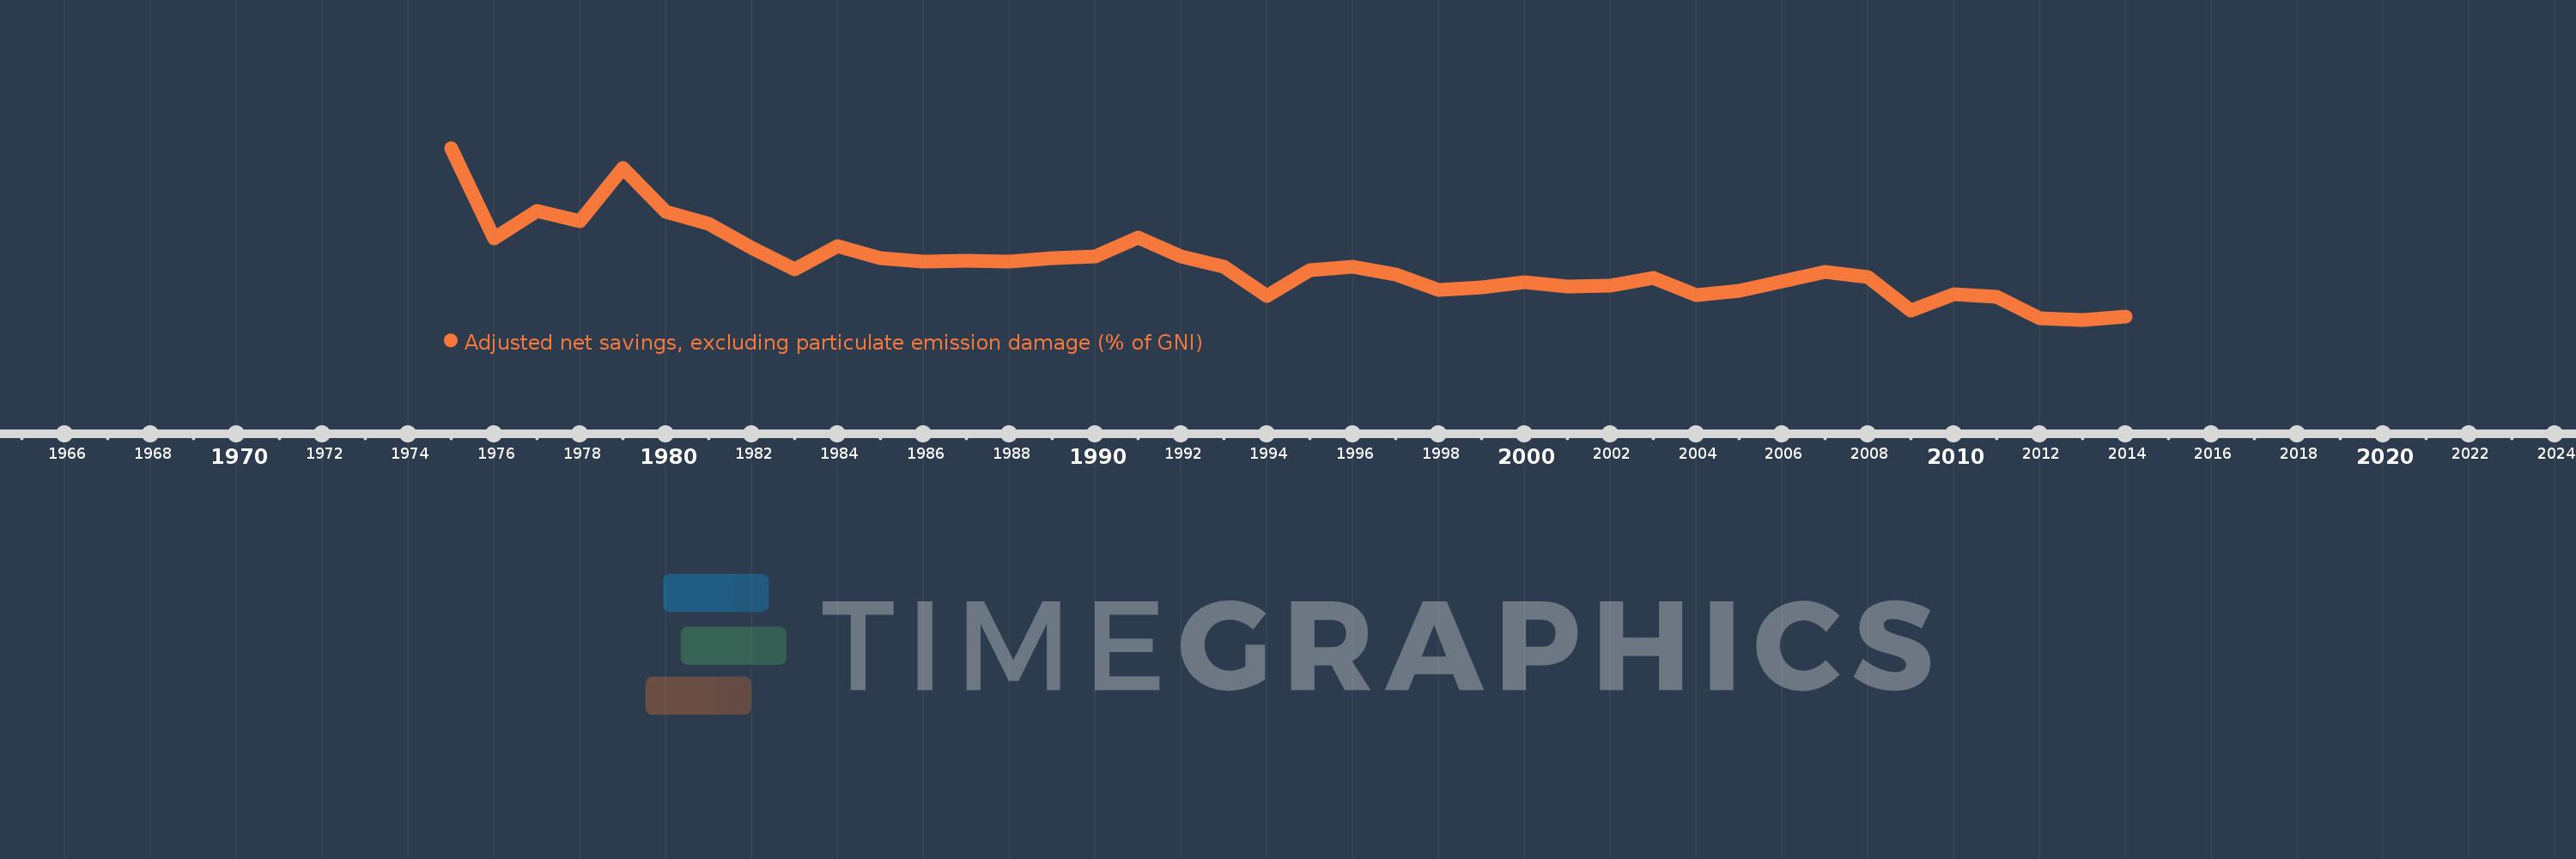
Adjusted net savings, excluding particulate emission damage (% of GNI)
2014,2013,2012,2011,2010,2009,2008,2007,2006,2005,2004,2003,2002,2001,2000,1999,1998,1997,1996,1995,1994,1993,1992,1991,1990,1989,1988,1987,1986,1985,1984,1983,1982,1981,1980,1979,1978,1977,1976,1975
This statistics in other country:
AfghanistanAlbaniaAlgeriaAngolaArab WorldArgentinaArmeniaAustraliaAustriaAzerbaijanBahamas, TheBahrainBangladeshBarbadosBelarusBelgiumBelizeBeninBhutanBoliviaBotswanaBrazilBrunei DarussalamBulgariaBurkina FasoBurundiCabo VerdeCambodiaCameroonCanadaCaribbean small statesCentral African RepublicCentral Europe and the BalticsChadChileChinaColombiaComorosCongo, Dem. Rep.Congo, Rep.Costa RicaCote d'IvoireCroatiaCyprusCzech RepublicDenmarkDjiboutiDominicaDominican RepublicEarly-demographic dividendEast Asia & PacificEast Asia & Pacific (excluding high income)East Asia & Pacific (IDA & IBRD countries)EcuadorEgypt, Arab Rep.El SalvadorEquatorial GuineaEritreaEstoniaEthiopiaEuro areaEurope & Central AsiaEurope & Central Asia (excluding high income)Europe & Central Asia (IDA & IBRD countries)European UnionFijiFinlandFragile and conflict affected situationsFranceGabonGambia, TheGeorgiaGermanyGhanaGreeceGuatemalaGuineaGuinea-BissauGuyanaHaitiHeavily indebted poor countries (HIPC)High incomeHondurasHungaryIBRD onlyIcelandIDA & IBRD totalIDA blendIDA onlyIDA totalIndiaIndonesiaIran, Islamic Rep.IraqIrelandIsraelItalyJamaicaJapanJordanKazakhstanKenyaKiribatiKorea, Rep.KuwaitKyrgyz RepublicLao PDRLate-demographic dividendLatin America & Caribbean Latin America & Caribbean (excluding high income)Latin America & the Caribbean (IDA & IBRD countries)LatviaLeast developed countries: UN classificationLebanonLesothoLiberiaLibyaLithuaniaLow & middle incomeLow incomeLower middle incomeLuxembourgMacedonia, FYRMadagascarMalawiMalaysiaMaldivesMaliMauritaniaMauritiusMexicoMiddle East & North AfricaMiddle East & North Africa (excluding high income)Middle East & North Africa (IDA & IBRD countries)Middle incomeMoldovaMongoliaMoroccoMozambiqueNamibiaNepalNetherlandsNew ZealandNicaraguaNigerNigeriaNorth AmericaNorwayOECD membersOmanOther small statesPacific island small statesPakistanPanamaPapua New GuineaParaguayPeruPhilippinesPolandPortugalPost-demographic dividendPre-demographic dividendQatarRomaniaRussian FederationRwandaSaudi ArabiaSenegalSeychellesSierra LeoneSingaporeSlovak RepublicSloveniaSmall statesSolomon IslandsSouth AfricaSouth AsiaSouth Asia (IDA & IBRD)SpainSri LankaSt. LuciaSt. Vincent and the GrenadinesSub-Saharan Africa Sub-Saharan Africa (excluding high income)Sub-Saharan Africa (IDA & IBRD countries)SudanSurinameSwazilandSwedenSwitzerlandSyrian Arab RepublicTajikistanTanzaniaThailandTogoTongaTrinidad and TobagoTunisiaTurkeyUgandaUkraineUnited KingdomUnited StatesUpper middle incomeUruguayVanuatuVenezuela, RBVietnamWorldYemen, Rep.ZambiaZimbabwe Timeline:
This timeline shows a graph from 1975 to 2014 of Togo. No data until 1974. Number of actual observations by date: 40.
Source name:
World Development Indicators
Source organization:
World Bank staff estimates based on sources and methods in World Bank's "The Changing Wealth of Nations: Measuring Sustainable Development in the New Millennium" (2011).
Categories, topics:
Economy & Growth, Environment
Last updated:
apr 23, 2017
Indicators value changes by year
Minimum:
-18.857
jan 1, 2013
Maximum:
46.809
jan 1, 1975
At the date of observation
Value
Absolute change
Change from previous value
jan 1, 1975
46.809
+46.809
0.0%
jan 1, 1976
12.37
-34.438
-73.57%
jan 1, 1977
22.616
+10.246
82.82%
jan 1, 1978
18.879
-3.737
-16.52%
jan 1, 1979
39.176
+20.297
107.51%
jan 1, 1980
22.332
-16.844
-43.0%
jan 1, 1981
17.754
-4.578
-20.5%
jan 1, 1982
8.654
-9.099
-51.25%
jan 1, 1983
0.382
-8.272
-95.58%
jan 1, 1984
9.409
+9.027
2.36K%
jan 1, 1985
4.568
-4.842
-51.46%
jan 1, 1986
3.357
-1.21
-26.5%
jan 1, 1987
3.676
+0.319
9.5%
jan 1, 1988
3.527
-0.15
-4.08%
jan 1, 1989
4.754
+1.228
34.81%
jan 1, 1990
5.329
+0.575
12.1%
jan 1, 1991
12.655
+7.326
137.46%
jan 1, 1992
5.309
-7.346
-58.05%
jan 1, 1993
1.372
-3.937
-74.17%
jan 1, 1994
-9.626
-10.998
-801.89%
jan 1, 1995
0.077
+9.704
-100.8%
jan 1, 1996
1.454
+1.377
1.79K%
jan 1, 1997
-1.564
-3.018
-207.53%
jan 1, 1998
-7.579
-6.015
384.65%
jan 1, 1999
-6.631
+0.949
-12.52%
jan 1, 2000
-4.491
+2.139
-32.27%
jan 1, 2001
-6.022
-1.531
34.09%
jan 1, 2002
-5.795
+0.228
-3.78%
jan 1, 2003
-2.766
+3.029
-52.27%
jan 1, 2004
-9.294
-6.528
236.04%
jan 1, 2005
-7.662
+1.632
-17.56%
jan 1, 2006
-4.26
+3.402
-44.4%
jan 1, 2007
-0.446
+3.814
-89.54%
jan 1, 2008
-2.466
-2.021
453.37%
jan 1, 2009
-15.483
-13.017
527.81%
jan 1, 2010
-9.127
+6.357
-41.06%
jan 1, 2011
-10.066
-0.939
10.29%
jan 1, 2012
-18.161
-8.095
80.42%
jan 1, 2013
-18.857
-0.697
3.84%
jan 1, 2014
-17.609
+1.248
-6.62%
Ranking of countries by current statistics by years


Comments: