29
/
en
AIzaSyAYiBZKx7MnpbEhh9jyipgxe19OcubqV5w
April 1, 2024
155532
Indonesia
IDN
true
2
1
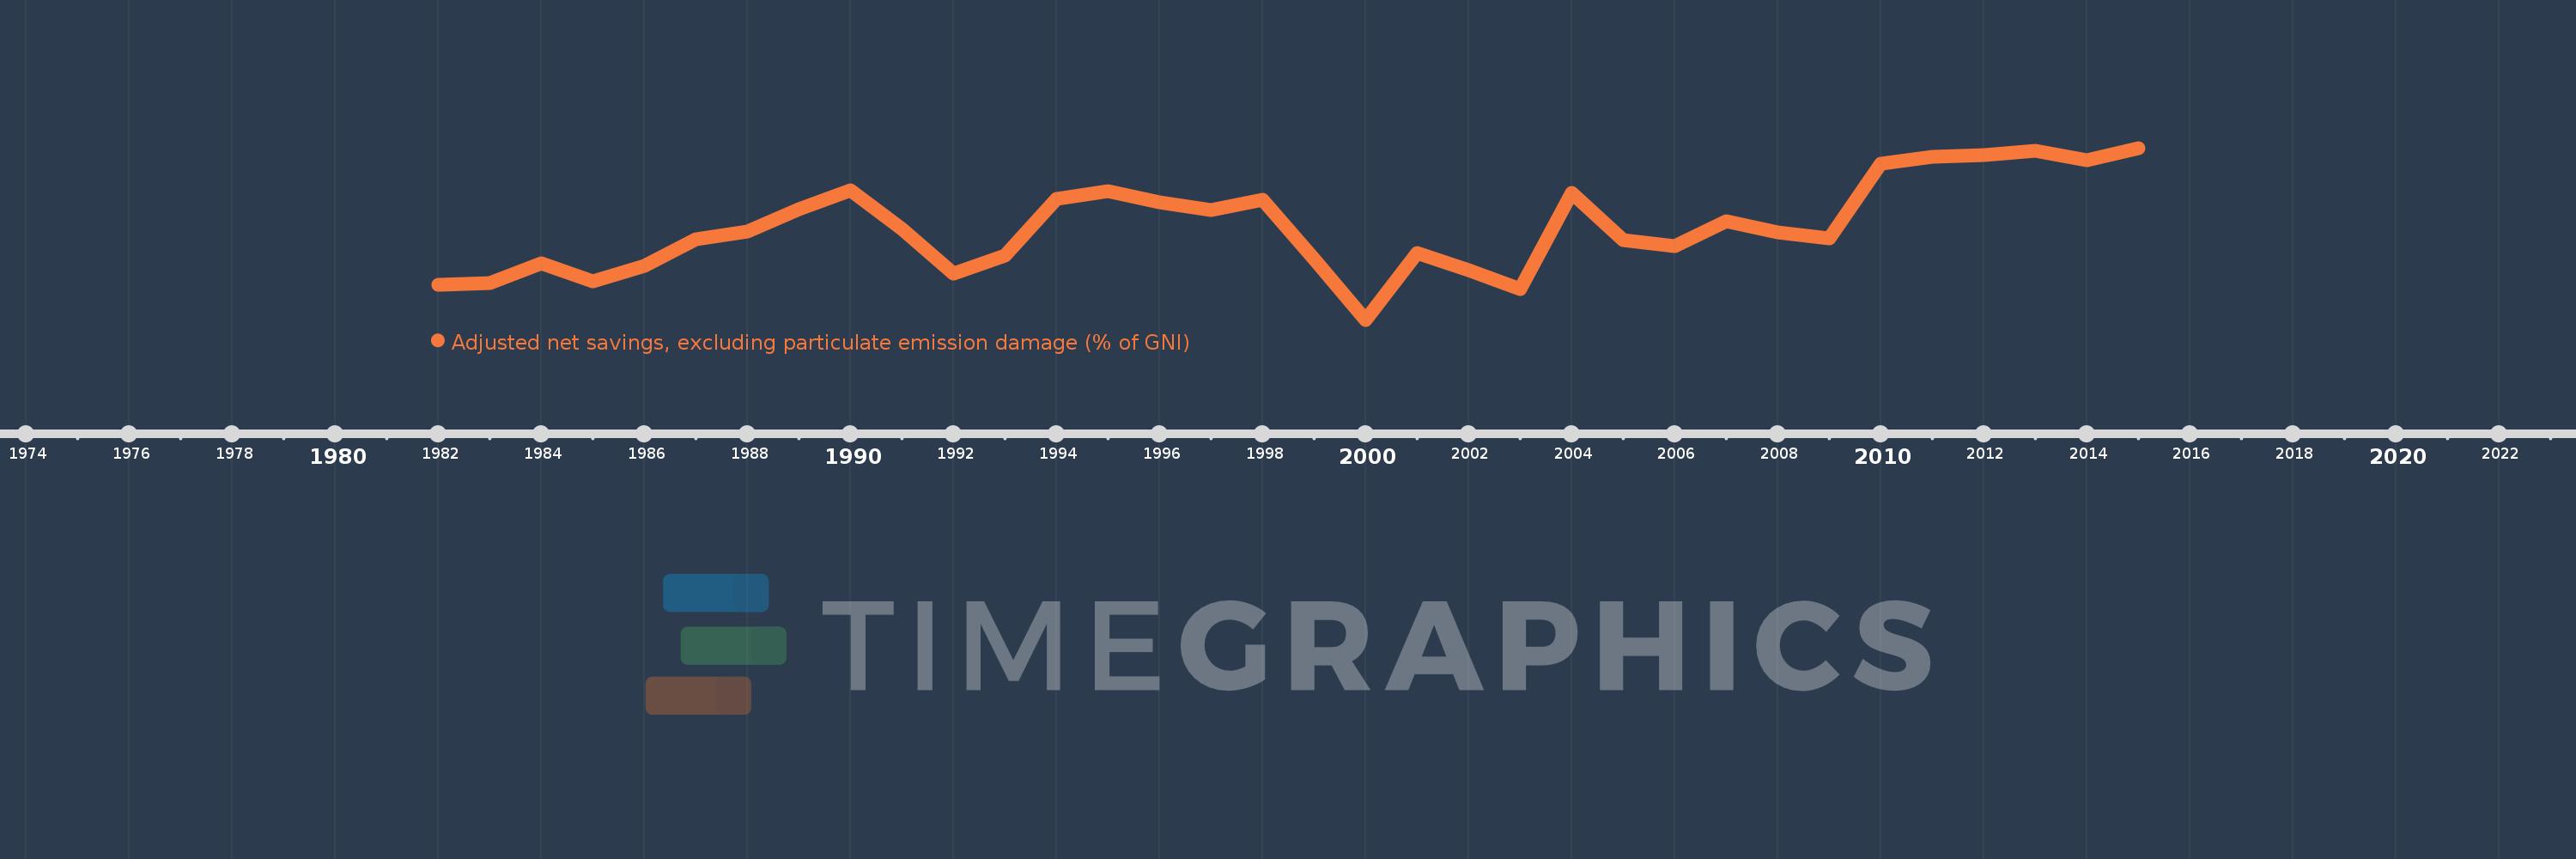
Adjusted net savings, excluding particulate emission damage (% of GNI)
2015,2014,2013,2012,2011,2010,2009,2008,2007,2006,2005,2004,2003,2002,2001,2000,1999,1998,1997,1996,1995,1994,1993,1992,1991,1990,1989,1988,1987,1986,1985,1984,1983,1982
This statistics in other country:
AfghanistanAlbaniaAlgeriaAngolaArab WorldArgentinaArmeniaAustraliaAustriaAzerbaijanBahamas, TheBahrainBangladeshBarbadosBelarusBelgiumBelizeBeninBhutanBoliviaBotswanaBrazilBrunei DarussalamBulgariaBurkina FasoBurundiCabo VerdeCambodiaCameroonCanadaCaribbean small statesCentral African RepublicCentral Europe and the BalticsChadChileChinaColombiaComorosCongo, Dem. Rep.Congo, Rep.Costa RicaCote d'IvoireCroatiaCyprusCzech RepublicDenmarkDjiboutiDominicaDominican RepublicEarly-demographic dividendEast Asia & PacificEast Asia & Pacific (excluding high income)East Asia & Pacific (IDA & IBRD countries)EcuadorEgypt, Arab Rep.El SalvadorEquatorial GuineaEritreaEstoniaEthiopiaEuro areaEurope & Central AsiaEurope & Central Asia (excluding high income)Europe & Central Asia (IDA & IBRD countries)European UnionFijiFinlandFragile and conflict affected situationsFranceGabonGambia, TheGeorgiaGermanyGhanaGreeceGuatemalaGuineaGuinea-BissauGuyanaHaitiHeavily indebted poor countries (HIPC)High incomeHondurasHungaryIBRD onlyIcelandIDA & IBRD totalIDA blendIDA onlyIDA totalIndiaIndonesiaIran, Islamic Rep.IraqIrelandIsraelItalyJamaicaJapanJordanKazakhstanKenyaKiribatiKorea, Rep.KuwaitKyrgyz RepublicLao PDRLate-demographic dividendLatin America & Caribbean Latin America & Caribbean (excluding high income)Latin America & the Caribbean (IDA & IBRD countries)LatviaLeast developed countries: UN classificationLebanonLesothoLiberiaLibyaLithuaniaLow & middle incomeLow incomeLower middle incomeLuxembourgMacedonia, FYRMadagascarMalawiMalaysiaMaldivesMaliMauritaniaMauritiusMexicoMiddle East & North AfricaMiddle East & North Africa (excluding high income)Middle East & North Africa (IDA & IBRD countries)Middle incomeMoldovaMongoliaMoroccoMozambiqueNamibiaNepalNetherlandsNew ZealandNicaraguaNigerNigeriaNorth AmericaNorwayOECD membersOmanOther small statesPacific island small statesPakistanPanamaPapua New GuineaParaguayPeruPhilippinesPolandPortugalPost-demographic dividendPre-demographic dividendQatarRomaniaRussian FederationRwandaSaudi ArabiaSenegalSeychellesSierra LeoneSingaporeSlovak RepublicSloveniaSmall statesSolomon IslandsSouth AfricaSouth AsiaSouth Asia (IDA & IBRD)SpainSri LankaSt. LuciaSt. Vincent and the GrenadinesSub-Saharan Africa Sub-Saharan Africa (excluding high income)Sub-Saharan Africa (IDA & IBRD countries)SudanSurinameSwazilandSwedenSwitzerlandSyrian Arab RepublicTajikistanTanzaniaThailandTogoTongaTrinidad and TobagoTunisiaTurkeyUgandaUkraineUnited KingdomUnited StatesUpper middle incomeUruguayVanuatuVenezuela, RBVietnamWorldYemen, Rep.ZambiaZimbabwe Timeline:
This timeline shows a graph from 1982 to 2015 of Indonesia. No data until 1981. Number of actual observations by date: 34.
Source name:
World Development Indicators
Source organization:
World Bank staff estimates based on sources and methods in World Bank's "The Changing Wealth of Nations: Measuring Sustainable Development in the New Millennium" (2011).
Categories, topics:
Economy & Growth, Environment
Last updated:
apr 23, 2017
Indicators value changes by year
Maximum:
26.875
jan 1, 2015
At the date of observation
Value
Absolute change
Change from previous value
jan 1, 1982
8.329
+8.329
0.0%
jan 1, 1983
8.588
+0.259
3.1%
jan 1, 1984
11.239
+2.651
30.87%
jan 1, 1985
8.857
-2.382
-21.19%
jan 1, 1986
10.9
+2.042
23.06%
jan 1, 1987
14.579
+3.679
33.75%
jan 1, 1988
15.523
+0.944
6.48%
jan 1, 1989
18.572
+3.049
19.64%
jan 1, 1990
21.169
+2.597
13.99%
jan 1, 1991
15.958
-5.211
-24.61%
jan 1, 1992
9.864
-6.094
-38.19%
jan 1, 1993
12.363
+2.499
25.34%
jan 1, 1994
19.99
+7.626
61.69%
jan 1, 1995
21.089
+1.1
5.5%
jan 1, 1996
19.487
-1.603
-7.6%
jan 1, 1997
18.51
-0.977
-5.01%
jan 1, 1998
19.93
+1.42
7.67%
jan 1, 1999
11.807
-8.123
-40.76%
jan 1, 2000
3.656
-8.152
-69.04%
jan 1, 2001
12.653
+8.998
246.14%
jan 1, 2002
10.37
-2.283
-18.04%
jan 1, 2003
7.822
-2.549
-24.58%
jan 1, 2004
20.752
+12.931
165.32%
jan 1, 2005
14.443
-6.309
-30.4%
jan 1, 2006
13.56
-0.883
-6.11%
jan 1, 2007
17.009
+3.449
25.43%
jan 1, 2008
15.476
-1.533
-9.01%
jan 1, 2009
14.635
-0.842
-5.44%
jan 1, 2010
24.73
+10.095
68.98%
jan 1, 2011
25.648
+0.919
3.71%
jan 1, 2012
25.873
+0.225
0.88%
jan 1, 2013
26.528
+0.654
2.53%
jan 1, 2014
25.203
-1.325
-4.99%
jan 1, 2015
26.875
+1.672
6.63%
Ranking of countries by current statistics by years


Comments: