29
/
en
AIzaSyAYiBZKx7MnpbEhh9jyipgxe19OcubqV5w
April 1, 2024
139935
Ghana
GHA
true
2
1
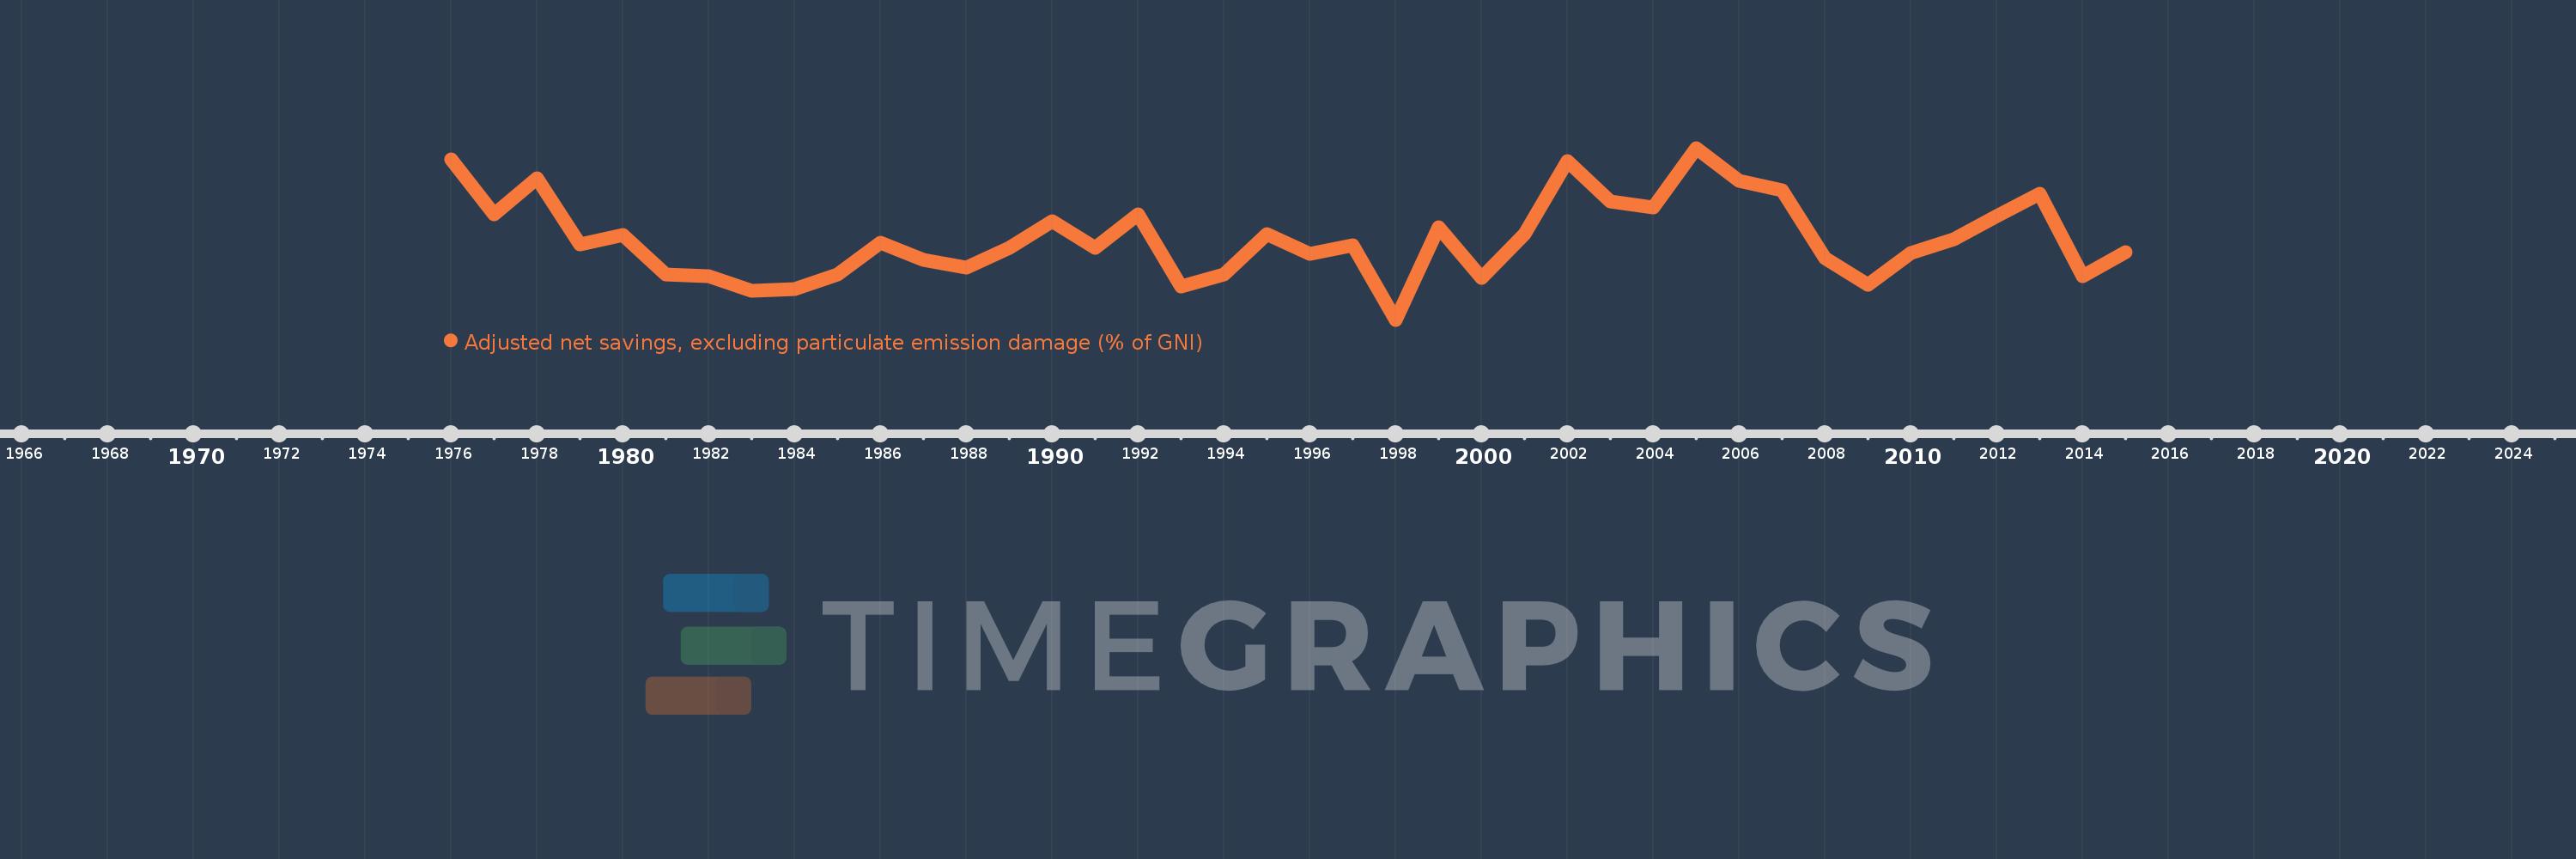
Adjusted net savings, excluding particulate emission damage (% of GNI)
2015,2014,2013,2012,2011,2010,2009,2008,2007,2006,2005,2004,2003,2002,2001,2000,1999,1998,1997,1996,1995,1994,1993,1992,1991,1990,1989,1988,1987,1986,1985,1984,1983,1982,1981,1980,1979,1978,1977,1976
This statistics in other country:
AfghanistanAlbaniaAlgeriaAngolaArab WorldArgentinaArmeniaAustraliaAustriaAzerbaijanBahamas, TheBahrainBangladeshBarbadosBelarusBelgiumBelizeBeninBhutanBoliviaBotswanaBrazilBrunei DarussalamBulgariaBurkina FasoBurundiCabo VerdeCambodiaCameroonCanadaCaribbean small statesCentral African RepublicCentral Europe and the BalticsChadChileChinaColombiaComorosCongo, Dem. Rep.Congo, Rep.Costa RicaCote d'IvoireCroatiaCyprusCzech RepublicDenmarkDjiboutiDominicaDominican RepublicEarly-demographic dividendEast Asia & PacificEast Asia & Pacific (excluding high income)East Asia & Pacific (IDA & IBRD countries)EcuadorEgypt, Arab Rep.El SalvadorEquatorial GuineaEritreaEstoniaEthiopiaEuro areaEurope & Central AsiaEurope & Central Asia (excluding high income)Europe & Central Asia (IDA & IBRD countries)European UnionFijiFinlandFragile and conflict affected situationsFranceGabonGambia, TheGeorgiaGermanyGhanaGreeceGuatemalaGuineaGuinea-BissauGuyanaHaitiHeavily indebted poor countries (HIPC)High incomeHondurasHungaryIBRD onlyIcelandIDA & IBRD totalIDA blendIDA onlyIDA totalIndiaIndonesiaIran, Islamic Rep.IraqIrelandIsraelItalyJamaicaJapanJordanKazakhstanKenyaKiribatiKorea, Rep.KuwaitKyrgyz RepublicLao PDRLate-demographic dividendLatin America & Caribbean Latin America & Caribbean (excluding high income)Latin America & the Caribbean (IDA & IBRD countries)LatviaLeast developed countries: UN classificationLebanonLesothoLiberiaLibyaLithuaniaLow & middle incomeLow incomeLower middle incomeLuxembourgMacedonia, FYRMadagascarMalawiMalaysiaMaldivesMaliMauritaniaMauritiusMexicoMiddle East & North AfricaMiddle East & North Africa (excluding high income)Middle East & North Africa (IDA & IBRD countries)Middle incomeMoldovaMongoliaMoroccoMozambiqueNamibiaNepalNetherlandsNew ZealandNicaraguaNigerNigeriaNorth AmericaNorwayOECD membersOmanOther small statesPacific island small statesPakistanPanamaPapua New GuineaParaguayPeruPhilippinesPolandPortugalPost-demographic dividendPre-demographic dividendQatarRomaniaRussian FederationRwandaSaudi ArabiaSenegalSeychellesSierra LeoneSingaporeSlovak RepublicSloveniaSmall statesSolomon IslandsSouth AfricaSouth AsiaSouth Asia (IDA & IBRD)SpainSri LankaSt. LuciaSt. Vincent and the GrenadinesSub-Saharan Africa Sub-Saharan Africa (excluding high income)Sub-Saharan Africa (IDA & IBRD countries)SudanSurinameSwazilandSwedenSwitzerlandSyrian Arab RepublicTajikistanTanzaniaThailandTogoTongaTrinidad and TobagoTunisiaTurkeyUgandaUkraineUnited KingdomUnited StatesUpper middle incomeUruguayVanuatuVenezuela, RBVietnamWorldYemen, Rep.ZambiaZimbabwe Timeline:
This timeline shows a graph from 1976 to 2015 of Ghana. No data until 1975. Number of actual observations by date: 40.
Source name:
World Development Indicators
Source organization:
World Bank staff estimates based on sources and methods in World Bank's "The Changing Wealth of Nations: Measuring Sustainable Development in the New Millennium" (2011).
Categories, topics:
Economy & Growth, Environment
Last updated:
apr 23, 2017
Indicators value changes by year
At the date of observation
Value
Absolute change
Change from previous value
jan 1, 1976
10.609
+10.609
0.0%
jan 1, 1977
5.665
-4.944
-46.6%
jan 1, 1978
8.921
+3.256
57.48%
jan 1, 1979
2.985
-5.935
-66.53%
jan 1, 1980
3.812
+0.827
27.69%
jan 1, 1981
0.233
-3.579
-93.88%
jan 1, 1982
0.136
-0.098
-41.82%
jan 1, 1983
-1.195
-1.33
-979.57%
jan 1, 1984
-1.032
+0.162
-13.6%
jan 1, 1985
0.282
+1.314
-127.32%
jan 1, 1986
3.128
+2.846
1.01K%
jan 1, 1987
1.606
-1.522
-48.66%
jan 1, 1988
0.849
-0.757
-47.13%
jan 1, 1989
2.677
+1.828
215.35%
jan 1, 1990
5.066
+2.389
89.22%
jan 1, 1991
2.661
-2.405
-47.48%
jan 1, 1992
5.642
+2.981
112.02%
jan 1, 1993
-0.795
-6.437
-114.09%
jan 1, 1994
0.295
+1.09
-137.16%
jan 1, 1995
3.878
+3.582
1.21K%
jan 1, 1996
2.086
-1.792
-46.22%
jan 1, 1997
2.93
+0.845
40.52%
jan 1, 1998
-3.81
-6.741
-230.02%
jan 1, 1999
4.527
+8.337
-218.81%
jan 1, 2000
-0.072
-4.599
-101.6%
jan 1, 2001
3.921
+3.993
-5.52K%
jan 1, 2002
10.489
+6.568
167.5%
jan 1, 2003
6.872
-3.617
-34.48%
jan 1, 2004
6.321
-0.551
-8.02%
jan 1, 2005
11.65
+5.329
84.31%
jan 1, 2006
8.724
-2.927
-25.12%
jan 1, 2007
7.825
-0.898
-10.29%
jan 1, 2008
1.725
-6.1
-77.95%
jan 1, 2009
-0.649
-2.374
-137.63%
jan 1, 2010
2.222
+2.871
-442.2%
jan 1, 2011
3.465
+1.243
55.95%
jan 1, 2012
5.533
+2.068
59.7%
jan 1, 2013
7.493
+1.96
35.42%
jan 1, 2014
0.112
-7.38
-98.5%
jan 1, 2015
2.283
+2.171
1.93K%
Ranking of countries by current statistics by years


Comments: