29
/
en
AIzaSyAYiBZKx7MnpbEhh9jyipgxe19OcubqV5w
April 1, 2024
145283
Guinea
GIN
true
2
1
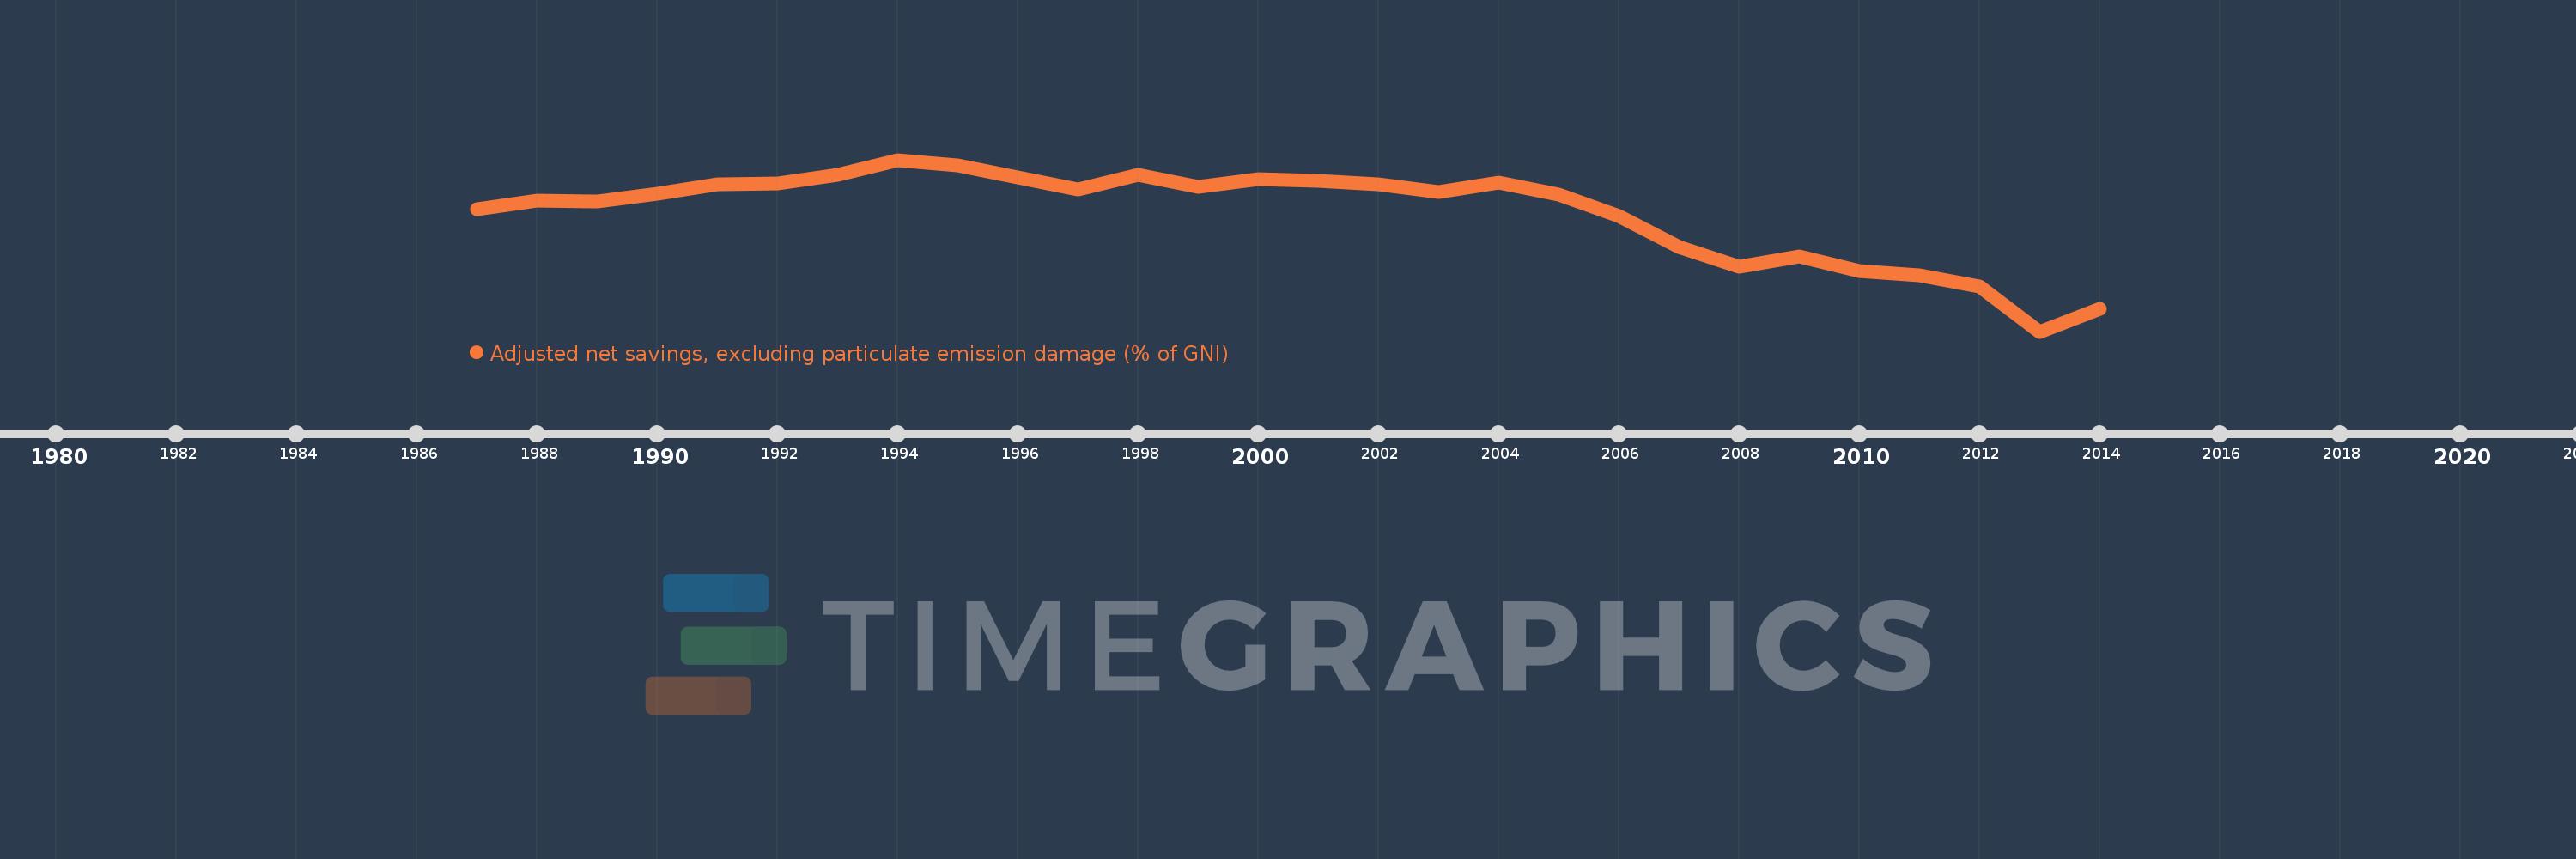
Adjusted net savings, excluding particulate emission damage (% of GNI)
2014,2013,2012,2011,2010,2009,2008,2007,2006,2005,2004,2003,2002,2001,2000,1999,1998,1997,1996,1995,1994,1993,1992,1991,1990,1989,1988,1987
This statistics in other country:
AfghanistanAlbaniaAlgeriaAngolaArab WorldArgentinaArmeniaAustraliaAustriaAzerbaijanBahamas, TheBahrainBangladeshBarbadosBelarusBelgiumBelizeBeninBhutanBoliviaBotswanaBrazilBrunei DarussalamBulgariaBurkina FasoBurundiCabo VerdeCambodiaCameroonCanadaCaribbean small statesCentral African RepublicCentral Europe and the BalticsChadChileChinaColombiaComorosCongo, Dem. Rep.Congo, Rep.Costa RicaCote d'IvoireCroatiaCyprusCzech RepublicDenmarkDjiboutiDominicaDominican RepublicEarly-demographic dividendEast Asia & PacificEast Asia & Pacific (excluding high income)East Asia & Pacific (IDA & IBRD countries)EcuadorEgypt, Arab Rep.El SalvadorEquatorial GuineaEritreaEstoniaEthiopiaEuro areaEurope & Central AsiaEurope & Central Asia (excluding high income)Europe & Central Asia (IDA & IBRD countries)European UnionFijiFinlandFragile and conflict affected situationsFranceGabonGambia, TheGeorgiaGermanyGhanaGreeceGuatemalaGuineaGuinea-BissauGuyanaHaitiHeavily indebted poor countries (HIPC)High incomeHondurasHungaryIBRD onlyIcelandIDA & IBRD totalIDA blendIDA onlyIDA totalIndiaIndonesiaIran, Islamic Rep.IraqIrelandIsraelItalyJamaicaJapanJordanKazakhstanKenyaKiribatiKorea, Rep.KuwaitKyrgyz RepublicLao PDRLate-demographic dividendLatin America & Caribbean Latin America & Caribbean (excluding high income)Latin America & the Caribbean (IDA & IBRD countries)LatviaLeast developed countries: UN classificationLebanonLesothoLiberiaLibyaLithuaniaLow & middle incomeLow incomeLower middle incomeLuxembourgMacedonia, FYRMadagascarMalawiMalaysiaMaldivesMaliMauritaniaMauritiusMexicoMiddle East & North AfricaMiddle East & North Africa (excluding high income)Middle East & North Africa (IDA & IBRD countries)Middle incomeMoldovaMongoliaMoroccoMozambiqueNamibiaNepalNetherlandsNew ZealandNicaraguaNigerNigeriaNorth AmericaNorwayOECD membersOmanOther small statesPacific island small statesPakistanPanamaPapua New GuineaParaguayPeruPhilippinesPolandPortugalPost-demographic dividendPre-demographic dividendQatarRomaniaRussian FederationRwandaSaudi ArabiaSenegalSeychellesSierra LeoneSingaporeSlovak RepublicSloveniaSmall statesSolomon IslandsSouth AfricaSouth AsiaSouth Asia (IDA & IBRD)SpainSri LankaSt. LuciaSt. Vincent and the GrenadinesSub-Saharan Africa Sub-Saharan Africa (excluding high income)Sub-Saharan Africa (IDA & IBRD countries)SudanSurinameSwazilandSwedenSwitzerlandSyrian Arab RepublicTajikistanTanzaniaThailandTogoTongaTrinidad and TobagoTunisiaTurkeyUgandaUkraineUnited KingdomUnited StatesUpper middle incomeUruguayVanuatuVenezuela, RBVietnamWorldYemen, Rep.ZambiaZimbabwe Timeline:
This timeline shows a graph from 1987 to 2014 of Guinea. No data until 1986. Number of actual observations by date: 28.
Source name:
World Development Indicators
Source organization:
World Bank staff estimates based on sources and methods in World Bank's "The Changing Wealth of Nations: Measuring Sustainable Development in the New Millennium" (2011).
Categories, topics:
Economy & Growth, Environment
Last updated:
apr 23, 2017
Indicators value changes by year
Minimum:
-54.989
jan 1, 2013
Maximum:
10.293
jan 1, 1994
At the date of observation
Value
Absolute change
Change from previous value
jan 1, 1987
-8.629
-8.629
0.0%
jan 1, 1988
-5.245
+3.383
-39.21%
jan 1, 1989
-5.621
-0.375
7.16%
jan 1, 1990
-2.62
+3.0
-53.38%
jan 1, 1991
1.027
+3.647
-139.2%
jan 1, 1992
1.385
+0.358
34.86%
jan 1, 1993
4.697
+3.312
239.11%
jan 1, 1994
10.293
+5.596
119.14%
jan 1, 1995
8.261
-2.032
-19.74%
jan 1, 1996
3.641
-4.62
-55.93%
jan 1, 1997
-0.95
-4.591
-126.1%
jan 1, 1998
4.587
+5.538
-582.67%
jan 1, 1999
-0.016
-4.603
-100.35%
jan 1, 2000
2.79
+2.806
-17.49K%
jan 1, 2001
2.176
-0.613
-21.98%
jan 1, 2002
0.977
-1.2
-55.13%
jan 1, 2003
-2.097
-3.073
-314.7%
jan 1, 2004
1.774
+3.871
-184.6%
jan 1, 2005
-2.868
-4.642
-261.68%
jan 1, 2006
-11.245
-8.376
292.05%
jan 1, 2007
-22.694
-11.45
101.82%
jan 1, 2008
-30.494
-7.8
34.37%
jan 1, 2009
-26.557
+3.937
-12.91%
jan 1, 2010
-32.099
-5.541
20.87%
jan 1, 2011
-33.625
-1.527
4.76%
jan 1, 2012
-37.925
-4.3
12.79%
jan 1, 2013
-54.989
-17.064
44.99%
jan 1, 2014
-46.474
+8.514
-15.48%
Ranking of countries by current statistics by years


Comments: