29
/
en
AIzaSyAYiBZKx7MnpbEhh9jyipgxe19OcubqV5w
April 1, 2024
141490
Greece
GRC
true
2
1
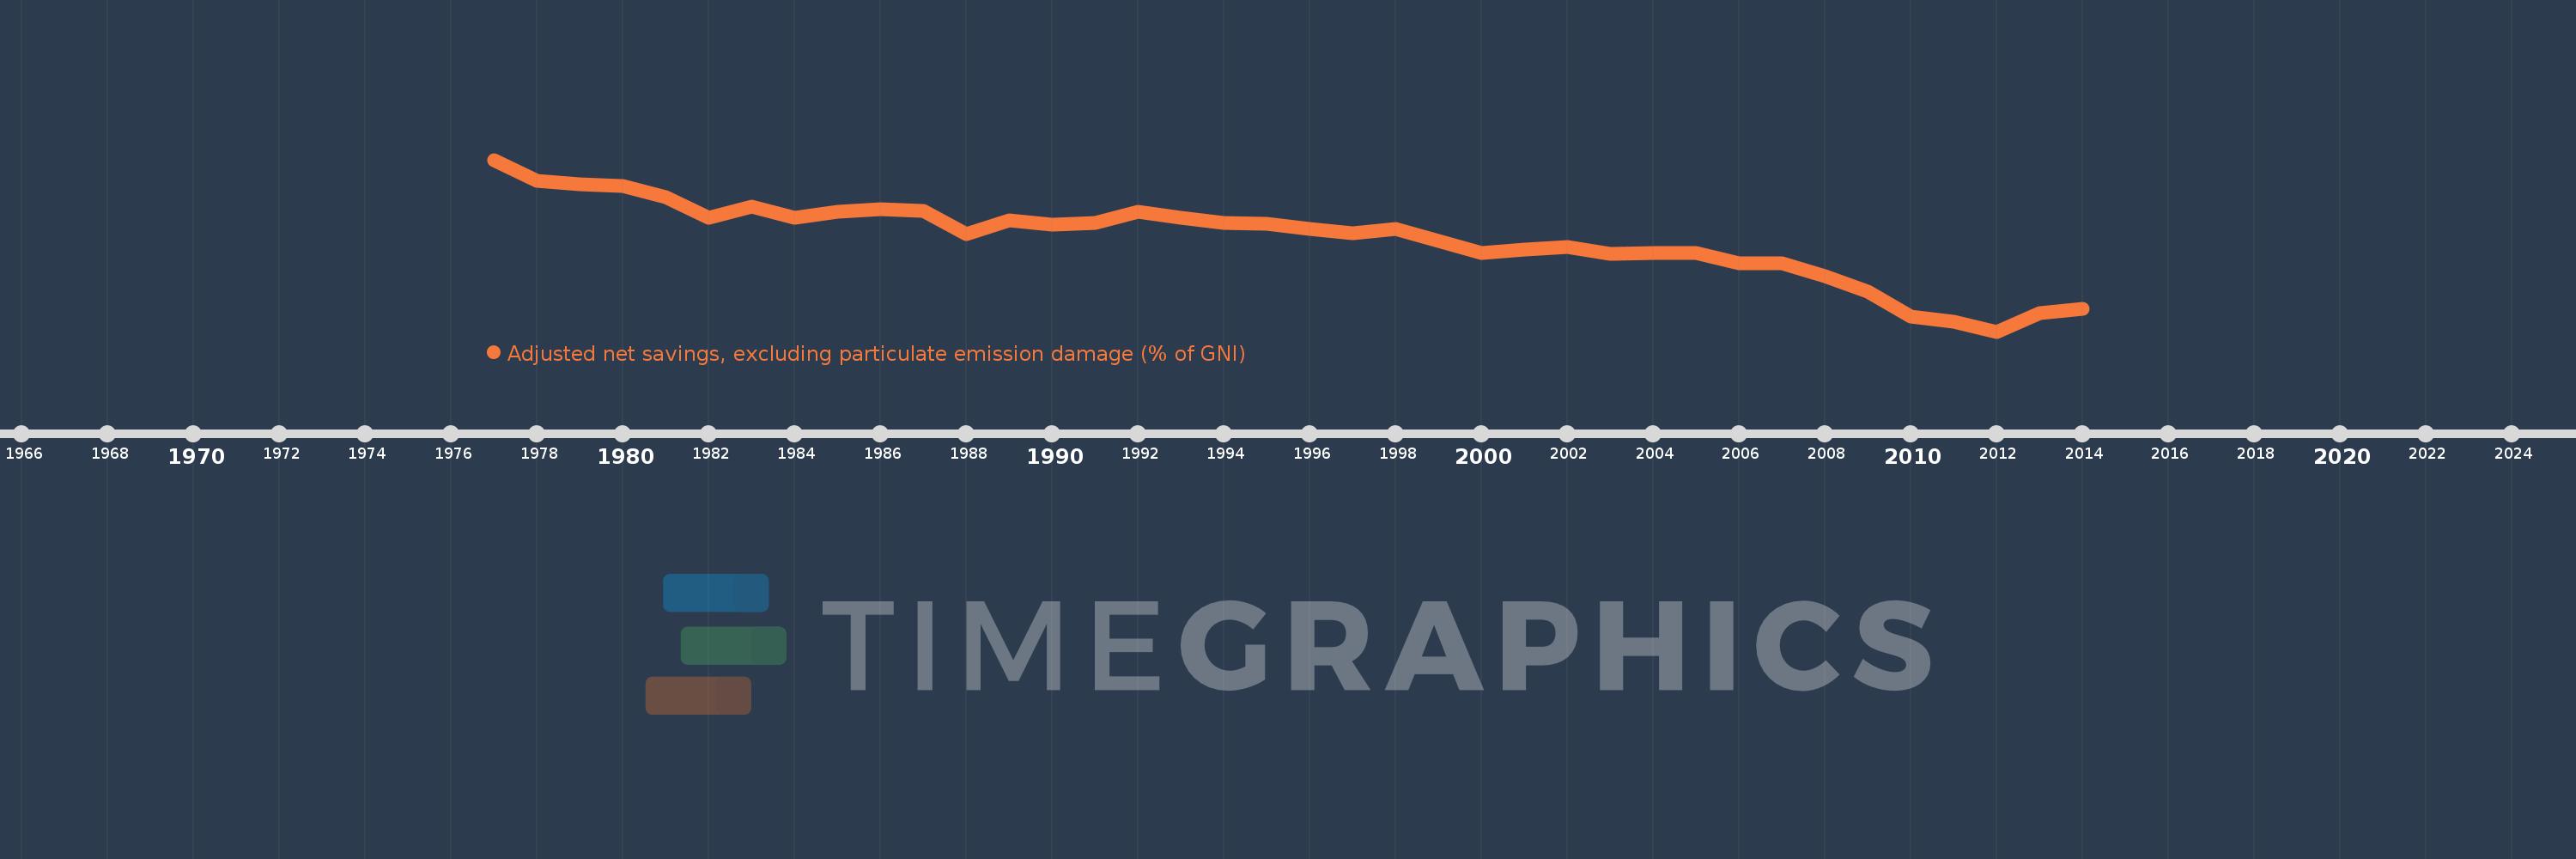
Adjusted net savings, excluding particulate emission damage (% of GNI)
2014,2013,2012,2011,2010,2009,2008,2007,2006,2005,2004,2003,2002,2001,2000,1998,1997,1996,1995,1994,1993,1992,1991,1990,1989,1988,1987,1986,1985,1984,1983,1982,1981,1980,1979,1978,1977
This statistics in other country:
AfghanistanAlbaniaAlgeriaAngolaArab WorldArgentinaArmeniaAustraliaAustriaAzerbaijanBahamas, TheBahrainBangladeshBarbadosBelarusBelgiumBelizeBeninBhutanBoliviaBotswanaBrazilBrunei DarussalamBulgariaBurkina FasoBurundiCabo VerdeCambodiaCameroonCanadaCaribbean small statesCentral African RepublicCentral Europe and the BalticsChadChileChinaColombiaComorosCongo, Dem. Rep.Congo, Rep.Costa RicaCote d'IvoireCroatiaCyprusCzech RepublicDenmarkDjiboutiDominicaDominican RepublicEarly-demographic dividendEast Asia & PacificEast Asia & Pacific (excluding high income)East Asia & Pacific (IDA & IBRD countries)EcuadorEgypt, Arab Rep.El SalvadorEquatorial GuineaEritreaEstoniaEthiopiaEuro areaEurope & Central AsiaEurope & Central Asia (excluding high income)Europe & Central Asia (IDA & IBRD countries)European UnionFijiFinlandFragile and conflict affected situationsFranceGabonGambia, TheGeorgiaGermanyGhanaGreeceGuatemalaGuineaGuinea-BissauGuyanaHaitiHeavily indebted poor countries (HIPC)High incomeHondurasHungaryIBRD onlyIcelandIDA & IBRD totalIDA blendIDA onlyIDA totalIndiaIndonesiaIran, Islamic Rep.IraqIrelandIsraelItalyJamaicaJapanJordanKazakhstanKenyaKiribatiKorea, Rep.KuwaitKyrgyz RepublicLao PDRLate-demographic dividendLatin America & Caribbean Latin America & Caribbean (excluding high income)Latin America & the Caribbean (IDA & IBRD countries)LatviaLeast developed countries: UN classificationLebanonLesothoLiberiaLibyaLithuaniaLow & middle incomeLow incomeLower middle incomeLuxembourgMacedonia, FYRMadagascarMalawiMalaysiaMaldivesMaliMauritaniaMauritiusMexicoMiddle East & North AfricaMiddle East & North Africa (excluding high income)Middle East & North Africa (IDA & IBRD countries)Middle incomeMoldovaMongoliaMoroccoMozambiqueNamibiaNepalNetherlandsNew ZealandNicaraguaNigerNigeriaNorth AmericaNorwayOECD membersOmanOther small statesPacific island small statesPakistanPanamaPapua New GuineaParaguayPeruPhilippinesPolandPortugalPost-demographic dividendPre-demographic dividendQatarRomaniaRussian FederationRwandaSaudi ArabiaSenegalSeychellesSierra LeoneSingaporeSlovak RepublicSloveniaSmall statesSolomon IslandsSouth AfricaSouth AsiaSouth Asia (IDA & IBRD)SpainSri LankaSt. LuciaSt. Vincent and the GrenadinesSub-Saharan Africa Sub-Saharan Africa (excluding high income)Sub-Saharan Africa (IDA & IBRD countries)SudanSurinameSwazilandSwedenSwitzerlandSyrian Arab RepublicTajikistanTanzaniaThailandTogoTongaTrinidad and TobagoTunisiaTurkeyUgandaUkraineUnited KingdomUnited StatesUpper middle incomeUruguayVanuatuVenezuela, RBVietnamWorldYemen, Rep.ZambiaZimbabwe Timeline:
This timeline shows a graph from 1977 to 2014 of Greece. No data until 1976. Number of actual observations by date: 37.
Source name:
World Development Indicators
Source organization:
World Bank staff estimates based on sources and methods in World Bank's "The Changing Wealth of Nations: Measuring Sustainable Development in the New Millennium" (2011).
Categories, topics:
Economy & Growth, Environment
Last updated:
apr 23, 2017
Indicators value changes by year
Minimum:
-10.489
jan 1, 2012
Maximum:
26.951
jan 1, 1977
At the date of observation
Value
Absolute change
Change from previous value
jan 1, 1977
26.951
+26.951
0.0%
jan 1, 1978
22.321
-4.63
-17.18%
jan 1, 1979
21.555
-0.766
-3.43%
jan 1, 1980
21.244
-0.311
-1.44%
jan 1, 1981
18.725
-2.519
-11.86%
jan 1, 1982
14.254
-4.471
-23.88%
jan 1, 1983
16.703
+2.449
17.18%
jan 1, 1984
14.356
-2.346
-14.05%
jan 1, 1985
15.63
+1.273
8.87%
jan 1, 1986
16.268
+0.638
4.08%
jan 1, 1987
15.88
-0.388
-2.38%
jan 1, 1988
10.713
-5.167
-32.54%
jan 1, 1989
13.718
+3.005
28.05%
jan 1, 1990
12.734
-0.984
-7.18%
jan 1, 1991
13.144
+0.411
3.22%
jan 1, 1992
15.69
+2.546
19.37%
jan 1, 1993
14.264
-1.426
-9.09%
jan 1, 1994
13.21
-1.054
-7.39%
jan 1, 1995
13.073
-0.137
-1.04%
jan 1, 1996
11.861
-1.212
-9.27%
jan 1, 1997
10.914
-0.947
-7.98%
jan 1, 1998
11.971
+1.057
9.69%
jan 1, 2000
6.626
-5.346
-44.65%
jan 1, 2001
7.416
+0.791
11.93%
jan 1, 2002
7.895
+0.479
6.46%
jan 1, 2003
6.485
-1.41
-17.86%
jan 1, 2004
6.626
+0.141
2.18%
jan 1, 2005
6.629
+0.003
0.04%
jan 1, 2006
4.412
-2.217
-33.44%
jan 1, 2007
4.383
-0.029
-0.65%
jan 1, 2008
1.671
-2.712
-61.88%
jan 1, 2009
-1.763
-3.433
-205.49%
jan 1, 2010
-7.127
-5.364
304.36%
jan 1, 2011
-8.415
-1.288
18.07%
jan 1, 2012
-10.489
-2.074
24.65%
jan 1, 2013
-6.404
+4.085
-38.95%
jan 1, 2014
-5.535
+0.868
-13.56%
Ranking of countries by current statistics by years


Comments: