29
/
en
AIzaSyAYiBZKx7MnpbEhh9jyipgxe19OcubqV5w
April 1, 2024
275375
United Kingdom
GBR
true
2
1
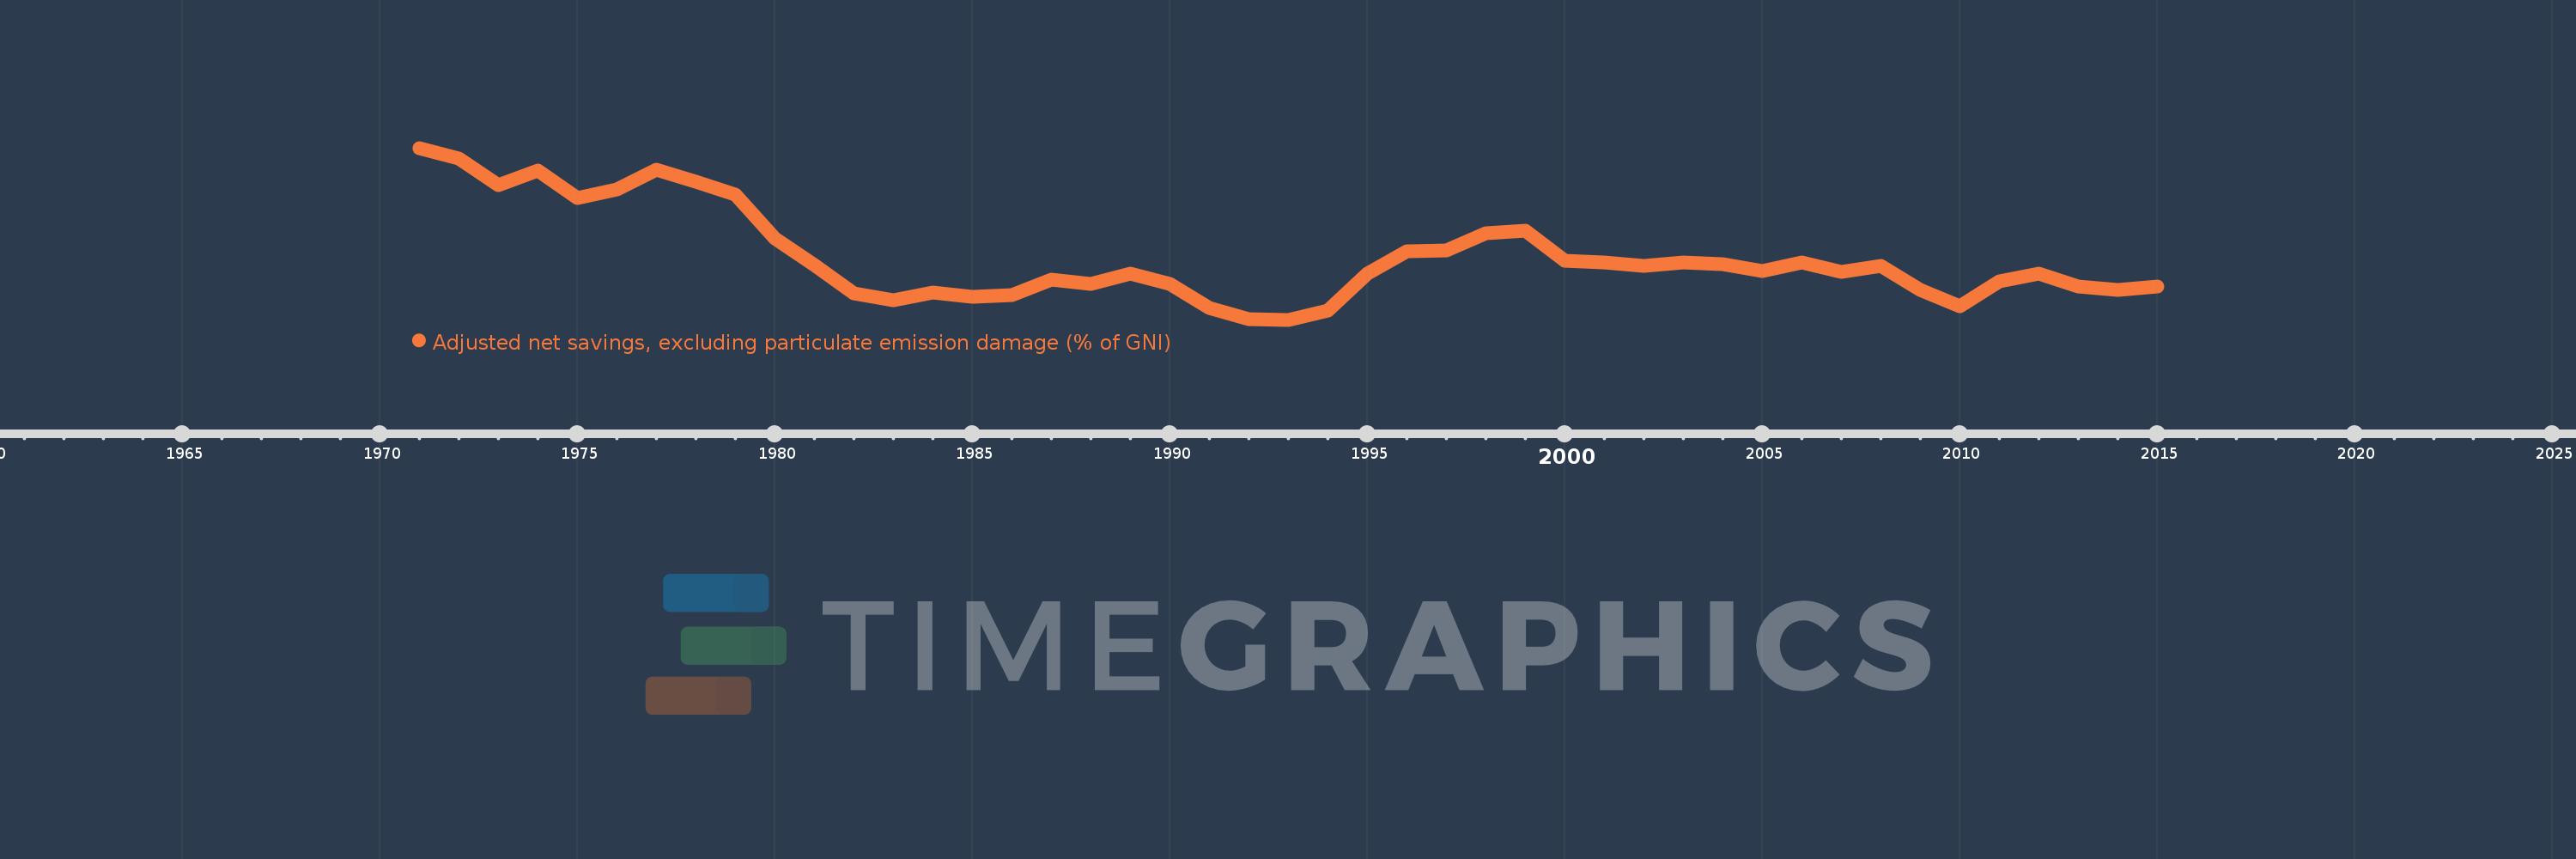
Adjusted net savings, excluding particulate emission damage (% of GNI)
2015,2014,2013,2012,2011,2010,2009,2008,2007,2006,2005,2004,2003,2002,2001,2000,1999,1998,1997,1996,1995,1994,1993,1992,1991,1990,1989,1988,1987,1986,1985,1984,1983,1982,1981,1980,1979,1978,1977,1976,1975,1974,1973,1972,1971
This statistics in other country:
AfghanistanAlbaniaAlgeriaAngolaArab WorldArgentinaArmeniaAustraliaAustriaAzerbaijanBahamas, TheBahrainBangladeshBarbadosBelarusBelgiumBelizeBeninBhutanBoliviaBotswanaBrazilBrunei DarussalamBulgariaBurkina FasoBurundiCabo VerdeCambodiaCameroonCanadaCaribbean small statesCentral African RepublicCentral Europe and the BalticsChadChileChinaColombiaComorosCongo, Dem. Rep.Congo, Rep.Costa RicaCote d'IvoireCroatiaCyprusCzech RepublicDenmarkDjiboutiDominicaDominican RepublicEarly-demographic dividendEast Asia & PacificEast Asia & Pacific (excluding high income)East Asia & Pacific (IDA & IBRD countries)EcuadorEgypt, Arab Rep.El SalvadorEquatorial GuineaEritreaEstoniaEthiopiaEuro areaEurope & Central AsiaEurope & Central Asia (excluding high income)Europe & Central Asia (IDA & IBRD countries)European UnionFijiFinlandFragile and conflict affected situationsFranceGabonGambia, TheGeorgiaGermanyGhanaGreeceGuatemalaGuineaGuinea-BissauGuyanaHaitiHeavily indebted poor countries (HIPC)High incomeHondurasHungaryIBRD onlyIcelandIDA & IBRD totalIDA blendIDA onlyIDA totalIndiaIndonesiaIran, Islamic Rep.IraqIrelandIsraelItalyJamaicaJapanJordanKazakhstanKenyaKiribatiKorea, Rep.KuwaitKyrgyz RepublicLao PDRLate-demographic dividendLatin America & Caribbean Latin America & Caribbean (excluding high income)Latin America & the Caribbean (IDA & IBRD countries)LatviaLeast developed countries: UN classificationLebanonLesothoLiberiaLibyaLithuaniaLow & middle incomeLow incomeLower middle incomeLuxembourgMacedonia, FYRMadagascarMalawiMalaysiaMaldivesMaliMauritaniaMauritiusMexicoMiddle East & North AfricaMiddle East & North Africa (excluding high income)Middle East & North Africa (IDA & IBRD countries)Middle incomeMoldovaMongoliaMoroccoMozambiqueNamibiaNepalNetherlandsNew ZealandNicaraguaNigerNigeriaNorth AmericaNorwayOECD membersOmanOther small statesPacific island small statesPakistanPanamaPapua New GuineaParaguayPeruPhilippinesPolandPortugalPost-demographic dividendPre-demographic dividendQatarRomaniaRussian FederationRwandaSaudi ArabiaSenegalSeychellesSierra LeoneSingaporeSlovak RepublicSloveniaSmall statesSolomon IslandsSouth AfricaSouth AsiaSouth Asia (IDA & IBRD)SpainSri LankaSt. LuciaSt. Vincent and the GrenadinesSub-Saharan Africa Sub-Saharan Africa (excluding high income)Sub-Saharan Africa (IDA & IBRD countries)SudanSurinameSwazilandSwedenSwitzerlandSyrian Arab RepublicTajikistanTanzaniaThailandTogoTongaTrinidad and TobagoTunisiaTurkeyUgandaUkraineUnited KingdomUnited StatesUpper middle incomeUruguayVanuatuVenezuela, RBVietnamWorldYemen, Rep.ZambiaZimbabwe Timeline:
This timeline shows a graph from 1971 to 2015 of United Kingdom. No data until 1970. Number of actual observations by date: 45.
Source name:
World Development Indicators
Source organization:
World Bank staff estimates based on sources and methods in World Bank's "The Changing Wealth of Nations: Measuring Sustainable Development in the New Millennium" (2011).
Categories, topics:
Economy & Growth, Environment
Last updated:
apr 23, 2017
Indicators value changes by year
At the date of observation
Value
Absolute change
Change from previous value
jan 1, 1971
16.46
+16.46
0.0%
jan 1, 1972
15.506
-0.954
-5.8%
jan 1, 1973
13.02
-2.486
-16.03%
jan 1, 1974
14.423
+1.403
10.78%
jan 1, 1975
11.846
-2.578
-17.87%
jan 1, 1976
12.64
+0.794
6.71%
jan 1, 1977
14.438
+1.798
14.23%
jan 1, 1978
13.333
-1.106
-7.66%
jan 1, 1979
12.188
-1.144
-8.58%
jan 1, 1980
8.141
-4.048
-33.21%
jan 1, 1981
5.725
-2.416
-29.67%
jan 1, 1982
3.141
-2.584
-45.13%
jan 1, 1983
2.458
-0.683
-21.73%
jan 1, 1984
3.186
+0.728
29.6%
jan 1, 1985
2.781
-0.406
-12.73%
jan 1, 1986
2.957
+0.176
6.33%
jan 1, 1987
4.352
+1.396
47.21%
jan 1, 1988
3.984
-0.368
-8.46%
jan 1, 1989
4.947
+0.963
24.17%
jan 1, 1990
3.95
-0.997
-20.15%
jan 1, 1991
1.793
-2.157
-54.61%
jan 1, 1992
0.728
-1.065
-59.42%
jan 1, 1993
0.703
-0.025
-3.38%
jan 1, 1994
1.568
+0.865
123.07%
jan 1, 1995
4.907
+3.339
212.9%
jan 1, 1996
6.946
+2.039
41.56%
jan 1, 1997
7.078
+0.132
1.91%
jan 1, 1998
8.621
+1.542
21.79%
jan 1, 1999
8.889
+0.268
3.11%
jan 1, 2000
6.139
-2.75
-30.94%
jan 1, 2001
5.994
-0.144
-2.35%
jan 1, 2002
5.617
-0.377
-6.29%
jan 1, 2003
5.955
+0.338
6.02%
jan 1, 2004
5.826
-0.129
-2.17%
jan 1, 2005
5.193
-0.633
-10.87%
jan 1, 2006
5.928
+0.734
14.14%
jan 1, 2007
5.086
-0.842
-14.2%
jan 1, 2008
5.632
+0.546
10.73%
jan 1, 2009
3.464
-2.168
-38.49%
jan 1, 2010
1.966
-1.498
-43.24%
jan 1, 2011
4.221
+2.255
114.67%
jan 1, 2012
4.957
+0.736
17.45%
jan 1, 2013
3.757
-1.2
-24.2%
jan 1, 2014
3.448
-0.309
-8.23%
jan 1, 2015
3.716
+0.268
7.78%
Ranking of countries by current statistics by years


Comments: