29
/
en
AIzaSyAYiBZKx7MnpbEhh9jyipgxe19OcubqV5w
April 1, 2024
211292
Niger
NER
true
2
1
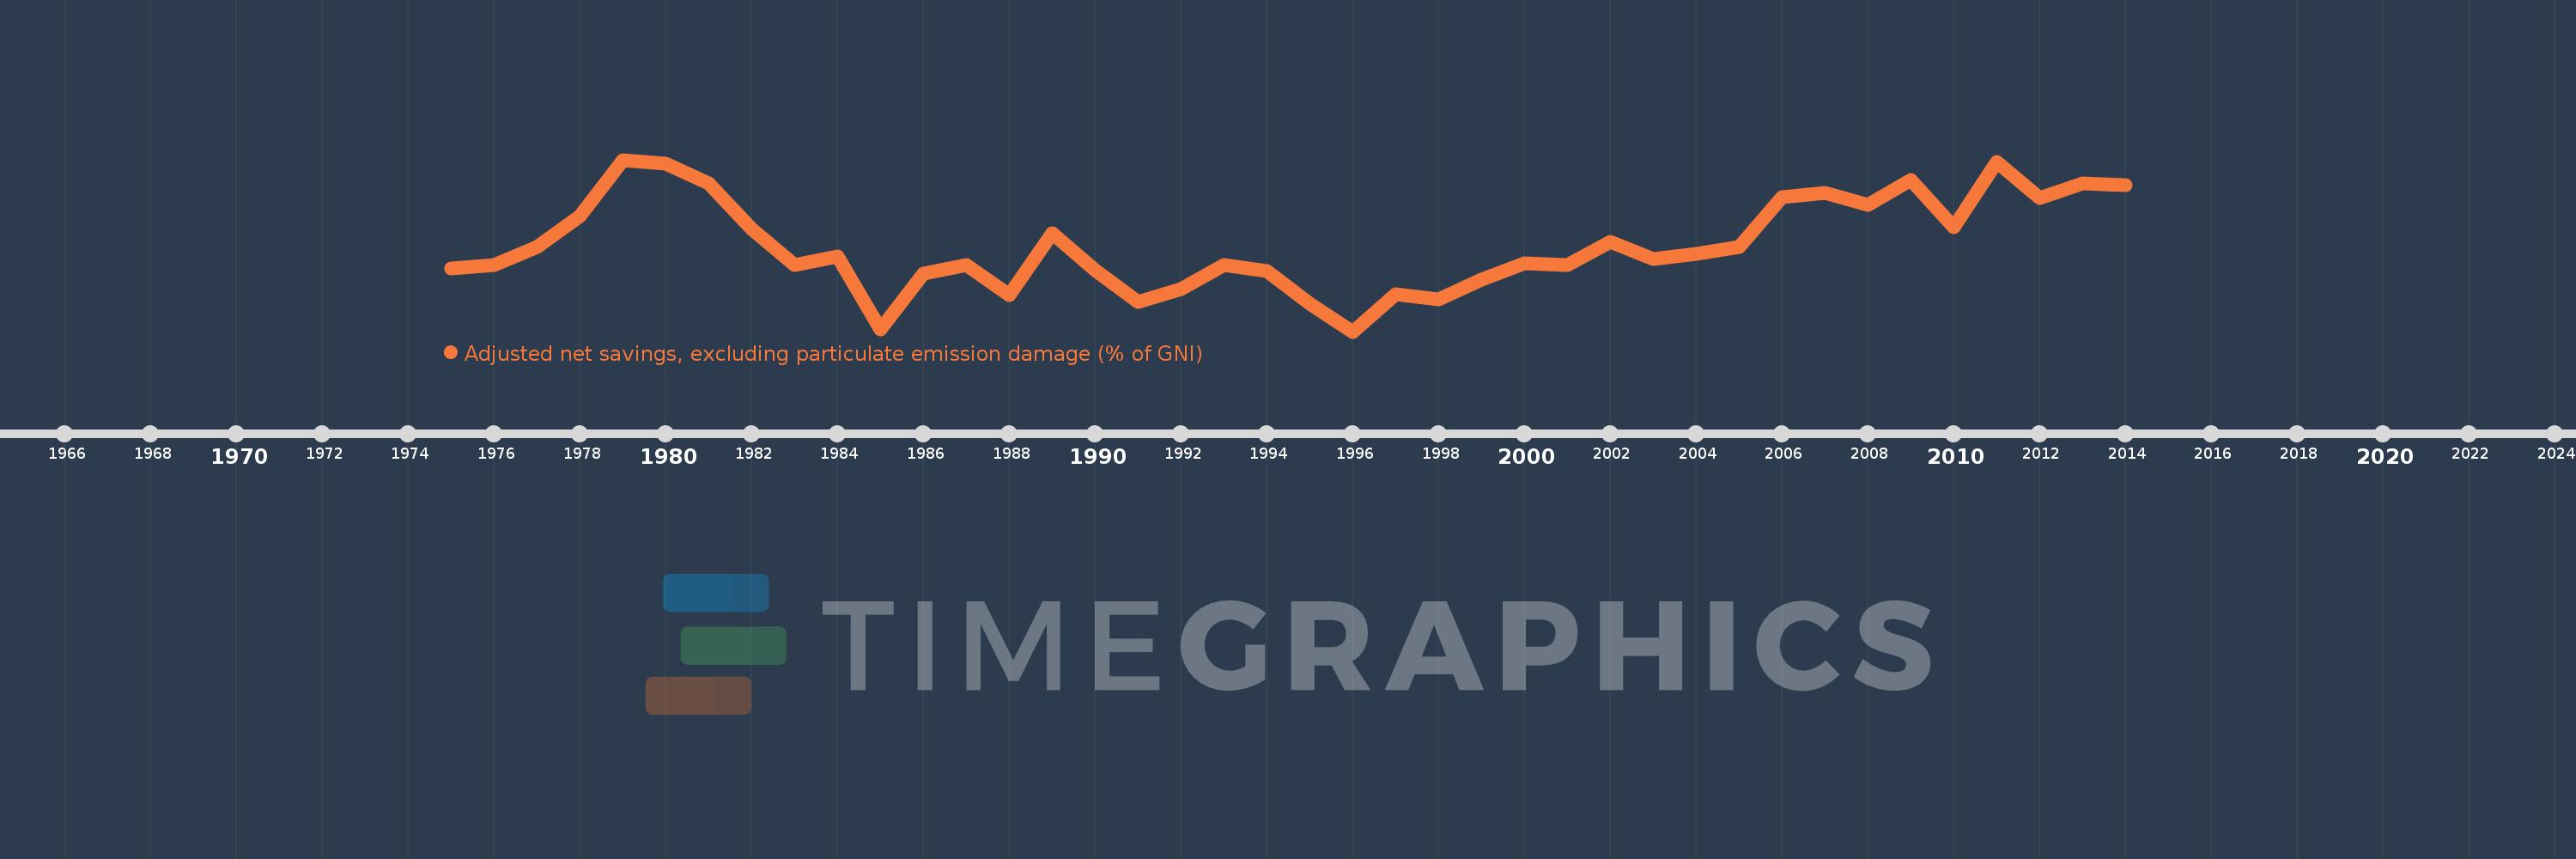
Adjusted net savings, excluding particulate emission damage (% of GNI)
2014,2013,2012,2011,2010,2009,2008,2007,2006,2005,2004,2003,2002,2001,2000,1999,1998,1997,1996,1995,1994,1993,1992,1991,1990,1989,1988,1987,1986,1985,1984,1983,1982,1981,1980,1979,1978,1977,1976,1975
This statistics in other country:
AfghanistanAlbaniaAlgeriaAngolaArab WorldArgentinaArmeniaAustraliaAustriaAzerbaijanBahamas, TheBahrainBangladeshBarbadosBelarusBelgiumBelizeBeninBhutanBoliviaBotswanaBrazilBrunei DarussalamBulgariaBurkina FasoBurundiCabo VerdeCambodiaCameroonCanadaCaribbean small statesCentral African RepublicCentral Europe and the BalticsChadChileChinaColombiaComorosCongo, Dem. Rep.Congo, Rep.Costa RicaCote d'IvoireCroatiaCyprusCzech RepublicDenmarkDjiboutiDominicaDominican RepublicEarly-demographic dividendEast Asia & PacificEast Asia & Pacific (excluding high income)East Asia & Pacific (IDA & IBRD countries)EcuadorEgypt, Arab Rep.El SalvadorEquatorial GuineaEritreaEstoniaEthiopiaEuro areaEurope & Central AsiaEurope & Central Asia (excluding high income)Europe & Central Asia (IDA & IBRD countries)European UnionFijiFinlandFragile and conflict affected situationsFranceGabonGambia, TheGeorgiaGermanyGhanaGreeceGuatemalaGuineaGuinea-BissauGuyanaHaitiHeavily indebted poor countries (HIPC)High incomeHondurasHungaryIBRD onlyIcelandIDA & IBRD totalIDA blendIDA onlyIDA totalIndiaIndonesiaIran, Islamic Rep.IraqIrelandIsraelItalyJamaicaJapanJordanKazakhstanKenyaKiribatiKorea, Rep.KuwaitKyrgyz RepublicLao PDRLate-demographic dividendLatin America & Caribbean Latin America & Caribbean (excluding high income)Latin America & the Caribbean (IDA & IBRD countries)LatviaLeast developed countries: UN classificationLebanonLesothoLiberiaLibyaLithuaniaLow & middle incomeLow incomeLower middle incomeLuxembourgMacedonia, FYRMadagascarMalawiMalaysiaMaldivesMaliMauritaniaMauritiusMexicoMiddle East & North AfricaMiddle East & North Africa (excluding high income)Middle East & North Africa (IDA & IBRD countries)Middle incomeMoldovaMongoliaMoroccoMozambiqueNamibiaNepalNetherlandsNew ZealandNicaraguaNigerNigeriaNorth AmericaNorwayOECD membersOmanOther small statesPacific island small statesPakistanPanamaPapua New GuineaParaguayPeruPhilippinesPolandPortugalPost-demographic dividendPre-demographic dividendQatarRomaniaRussian FederationRwandaSaudi ArabiaSenegalSeychellesSierra LeoneSingaporeSlovak RepublicSloveniaSmall statesSolomon IslandsSouth AfricaSouth AsiaSouth Asia (IDA & IBRD)SpainSri LankaSt. LuciaSt. Vincent and the GrenadinesSub-Saharan Africa Sub-Saharan Africa (excluding high income)Sub-Saharan Africa (IDA & IBRD countries)SudanSurinameSwazilandSwedenSwitzerlandSyrian Arab RepublicTajikistanTanzaniaThailandTogoTongaTrinidad and TobagoTunisiaTurkeyUgandaUkraineUnited KingdomUnited StatesUpper middle incomeUruguayVanuatuVenezuela, RBVietnamWorldYemen, Rep.ZambiaZimbabwe Timeline:
This timeline shows a graph from 1975 to 2014 of Niger. No data until 1974. Number of actual observations by date: 40.
Source name:
World Development Indicators
Source organization:
World Bank staff estimates based on sources and methods in World Bank's "The Changing Wealth of Nations: Measuring Sustainable Development in the New Millennium" (2011).
Categories, topics:
Economy & Growth, Environment
Last updated:
apr 23, 2017
Indicators value changes by year
Minimum:
-17.573
jan 1, 1996
Maximum:
11.987
jan 1, 1979
At the date of observation
Value
Absolute change
Change from previous value
jan 1, 1975
-6.639
-6.639
0.0%
jan 1, 1976
-6.186
+0.453
-6.82%
jan 1, 1977
-3.029
+3.157
-51.03%
jan 1, 1978
2.294
+5.323
-175.72%
jan 1, 1979
11.987
+9.693
422.57%
jan 1, 1980
11.394
-0.593
-4.95%
jan 1, 1981
7.995
-3.399
-29.83%
jan 1, 1982
0.057
-7.937
-99.28%
jan 1, 1983
-6.132
-6.189
-10.77K%
jan 1, 1984
-4.614
+1.518
-24.75%
jan 1, 1985
-17.226
-12.612
273.34%
jan 1, 1986
-7.659
+9.568
-55.54%
jan 1, 1987
-6.047
+1.612
-21.05%
jan 1, 1988
-11.363
-5.317
87.93%
jan 1, 1989
-0.603
+10.76
-94.69%
jan 1, 1990
-7.056
-6.453
1.07K%
jan 1, 1991
-12.45
-5.394
76.45%
jan 1, 1992
-10.272
+2.178
-17.49%
jan 1, 1993
-6.07
+4.203
-40.91%
jan 1, 1994
-7.087
-1.018
16.77%
jan 1, 1995
-12.734
-5.646
79.66%
jan 1, 1996
-17.573
-4.84
38.01%
jan 1, 1997
-11.178
+6.395
-36.39%
jan 1, 1998
-12.014
-0.836
7.48%
jan 1, 1999
-8.56
+3.454
-28.75%
jan 1, 2000
-5.822
+2.738
-31.98%
jan 1, 2001
-6.166
-0.344
5.91%
jan 1, 2002
-2.162
+4.004
-64.94%
jan 1, 2003
-5.138
-2.977
137.72%
jan 1, 2004
-4.141
+0.997
-19.41%
jan 1, 2005
-3.069
+1.072
-25.88%
jan 1, 2006
5.518
+8.588
-279.78%
jan 1, 2007
6.266
+0.748
13.55%
jan 1, 2008
4.183
-2.084
-33.25%
jan 1, 2009
8.448
+4.265
101.98%
jan 1, 2010
0.41
-8.038
-95.15%
jan 1, 2011
11.606
+11.197
2.73K%
jan 1, 2012
5.347
-6.259
-53.93%
jan 1, 2013
7.913
+2.565
47.98%
jan 1, 2014
7.643
-0.27
-3.41%
Ranking of countries by current statistics by years


Comments: