29
/
en
AIzaSyAYiBZKx7MnpbEhh9jyipgxe19OcubqV5w
April 1, 2024
162143
Jamaica
JAM
true
2
1
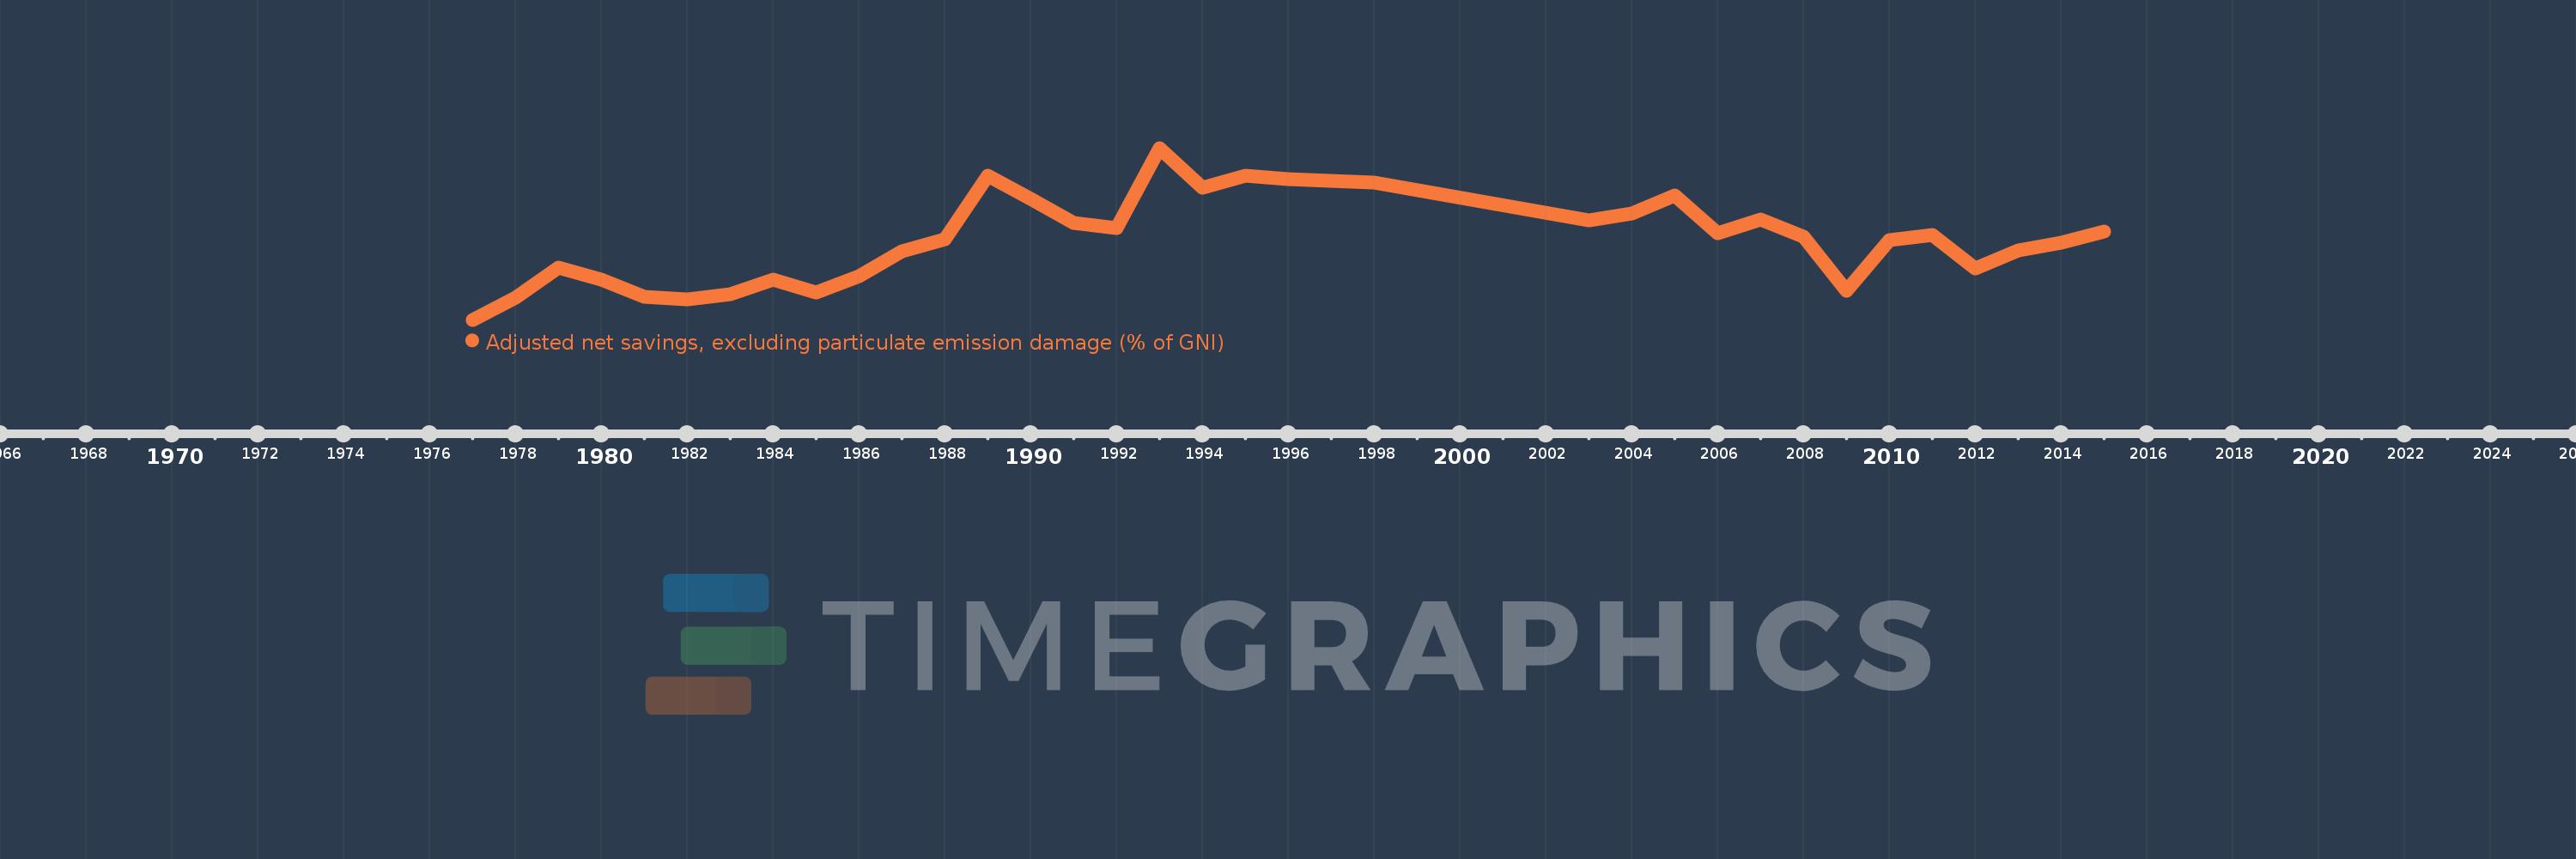
Adjusted net savings, excluding particulate emission damage (% of GNI)
2015,2014,2013,2012,2011,2010,2009,2008,2007,2006,2005,2004,2003,1998,1997,1996,1995,1994,1993,1992,1991,1990,1989,1988,1987,1986,1985,1984,1983,1982,1981,1980,1979,1978,1977
This statistics in other country:
AfghanistanAlbaniaAlgeriaAngolaArab WorldArgentinaArmeniaAustraliaAustriaAzerbaijanBahamas, TheBahrainBangladeshBarbadosBelarusBelgiumBelizeBeninBhutanBoliviaBotswanaBrazilBrunei DarussalamBulgariaBurkina FasoBurundiCabo VerdeCambodiaCameroonCanadaCaribbean small statesCentral African RepublicCentral Europe and the BalticsChadChileChinaColombiaComorosCongo, Dem. Rep.Congo, Rep.Costa RicaCote d'IvoireCroatiaCyprusCzech RepublicDenmarkDjiboutiDominicaDominican RepublicEarly-demographic dividendEast Asia & PacificEast Asia & Pacific (excluding high income)East Asia & Pacific (IDA & IBRD countries)EcuadorEgypt, Arab Rep.El SalvadorEquatorial GuineaEritreaEstoniaEthiopiaEuro areaEurope & Central AsiaEurope & Central Asia (excluding high income)Europe & Central Asia (IDA & IBRD countries)European UnionFijiFinlandFragile and conflict affected situationsFranceGabonGambia, TheGeorgiaGermanyGhanaGreeceGuatemalaGuineaGuinea-BissauGuyanaHaitiHeavily indebted poor countries (HIPC)High incomeHondurasHungaryIBRD onlyIcelandIDA & IBRD totalIDA blendIDA onlyIDA totalIndiaIndonesiaIran, Islamic Rep.IraqIrelandIsraelItalyJamaicaJapanJordanKazakhstanKenyaKiribatiKorea, Rep.KuwaitKyrgyz RepublicLao PDRLate-demographic dividendLatin America & Caribbean Latin America & Caribbean (excluding high income)Latin America & the Caribbean (IDA & IBRD countries)LatviaLeast developed countries: UN classificationLebanonLesothoLiberiaLibyaLithuaniaLow & middle incomeLow incomeLower middle incomeLuxembourgMacedonia, FYRMadagascarMalawiMalaysiaMaldivesMaliMauritaniaMauritiusMexicoMiddle East & North AfricaMiddle East & North Africa (excluding high income)Middle East & North Africa (IDA & IBRD countries)Middle incomeMoldovaMongoliaMoroccoMozambiqueNamibiaNepalNetherlandsNew ZealandNicaraguaNigerNigeriaNorth AmericaNorwayOECD membersOmanOther small statesPacific island small statesPakistanPanamaPapua New GuineaParaguayPeruPhilippinesPolandPortugalPost-demographic dividendPre-demographic dividendQatarRomaniaRussian FederationRwandaSaudi ArabiaSenegalSeychellesSierra LeoneSingaporeSlovak RepublicSloveniaSmall statesSolomon IslandsSouth AfricaSouth AsiaSouth Asia (IDA & IBRD)SpainSri LankaSt. LuciaSt. Vincent and the GrenadinesSub-Saharan Africa Sub-Saharan Africa (excluding high income)Sub-Saharan Africa (IDA & IBRD countries)SudanSurinameSwazilandSwedenSwitzerlandSyrian Arab RepublicTajikistanTanzaniaThailandTogoTongaTrinidad and TobagoTunisiaTurkeyUgandaUkraineUnited KingdomUnited StatesUpper middle incomeUruguayVanuatuVenezuela, RBVietnamWorldYemen, Rep.ZambiaZimbabwe Timeline:
This timeline shows a graph from 1977 to 2015 of Jamaica. No data until 1976. Number of actual observations by date: 35.
Source name:
World Development Indicators
Source organization:
World Bank staff estimates based on sources and methods in World Bank's "The Changing Wealth of Nations: Measuring Sustainable Development in the New Millennium" (2011).
Categories, topics:
Economy & Growth, Environment
Last updated:
apr 23, 2017
Indicators value changes by year
Minimum:
-1.495
jan 1, 1977
At the date of observation
Value
Absolute change
Change from previous value
jan 1, 1977
-1.495
-1.495
0.0%
jan 1, 1978
1.69
+3.185
-213.02%
jan 1, 1979
5.961
+4.271
252.74%
jan 1, 1980
4.161
-1.8
-30.19%
jan 1, 1981
1.72
-2.441
-58.66%
jan 1, 1982
1.434
-0.286
-16.65%
jan 1, 1983
2.093
+0.659
45.96%
jan 1, 1984
4.148
+2.055
98.19%
jan 1, 1985
2.432
-1.717
-41.38%
jan 1, 1986
4.695
+2.263
93.06%
jan 1, 1987
8.181
+3.486
74.25%
jan 1, 1988
9.903
+1.723
21.06%
jan 1, 1989
19.009
+9.106
91.95%
jan 1, 1990
15.677
-3.332
-17.53%
jan 1, 1991
12.277
-3.4
-21.69%
jan 1, 1992
11.547
-0.73
-5.94%
jan 1, 1993
22.92
+11.373
98.49%
jan 1, 1994
17.261
-5.658
-24.69%
jan 1, 1995
18.962
+1.701
9.85%
jan 1, 1996
18.51
-0.452
-2.39%
jan 1, 1997
18.186
-0.324
-1.75%
jan 1, 1998
18.031
-0.155
-0.85%
jan 1, 2003
12.571
-5.46
-30.28%
jan 1, 2004
13.591
+1.02
8.11%
jan 1, 2005
16.21
+2.619
19.27%
jan 1, 2006
10.843
-5.368
-33.11%
jan 1, 2007
12.751
+1.908
17.6%
jan 1, 2008
10.315
-2.436
-19.1%
jan 1, 2009
2.64
-7.675
-74.41%
jan 1, 2010
9.837
+7.197
272.65%
jan 1, 2011
10.493
+0.656
6.67%
jan 1, 2012
5.796
-4.697
-44.76%
jan 1, 2013
8.325
+2.529
43.64%
jan 1, 2014
9.43
+1.105
13.27%
jan 1, 2015
11.038
+1.608
17.05%
Ranking of countries by current statistics by years


Comments: