29
/
en
AIzaSyAYiBZKx7MnpbEhh9jyipgxe19OcubqV5w
April 1, 2024
217899
Panama
PAN
true
2
1
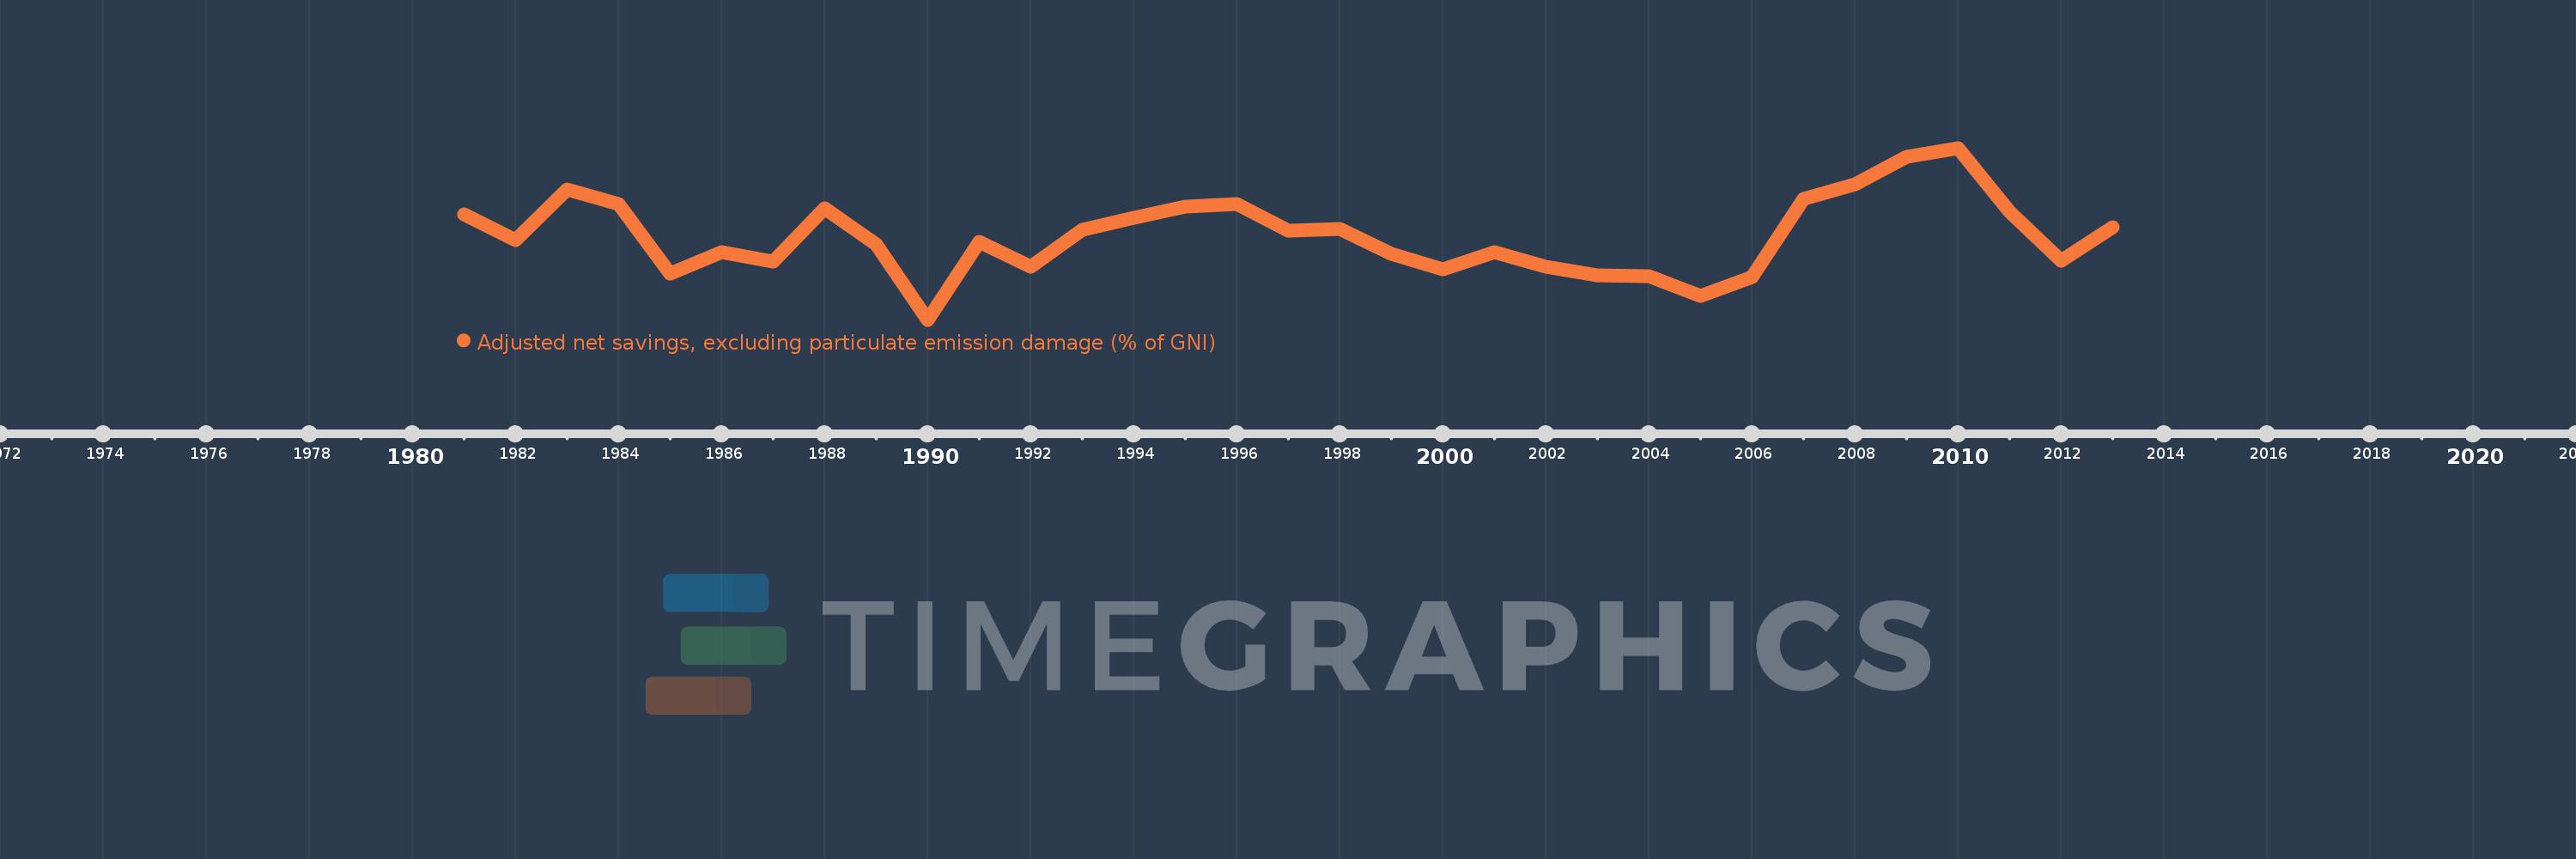
Adjusted net savings, excluding particulate emission damage (% of GNI)
2013,2012,2011,2010,2009,2008,2007,2006,2005,2004,2003,2002,2001,2000,1999,1998,1997,1996,1995,1994,1993,1992,1991,1990,1989,1988,1987,1986,1985,1984,1983,1982,1981
This statistics in other country:
AfghanistanAlbaniaAlgeriaAngolaArab WorldArgentinaArmeniaAustraliaAustriaAzerbaijanBahamas, TheBahrainBangladeshBarbadosBelarusBelgiumBelizeBeninBhutanBoliviaBotswanaBrazilBrunei DarussalamBulgariaBurkina FasoBurundiCabo VerdeCambodiaCameroonCanadaCaribbean small statesCentral African RepublicCentral Europe and the BalticsChadChileChinaColombiaComorosCongo, Dem. Rep.Congo, Rep.Costa RicaCote d'IvoireCroatiaCyprusCzech RepublicDenmarkDjiboutiDominicaDominican RepublicEarly-demographic dividendEast Asia & PacificEast Asia & Pacific (excluding high income)East Asia & Pacific (IDA & IBRD countries)EcuadorEgypt, Arab Rep.El SalvadorEquatorial GuineaEritreaEstoniaEthiopiaEuro areaEurope & Central AsiaEurope & Central Asia (excluding high income)Europe & Central Asia (IDA & IBRD countries)European UnionFijiFinlandFragile and conflict affected situationsFranceGabonGambia, TheGeorgiaGermanyGhanaGreeceGuatemalaGuineaGuinea-BissauGuyanaHaitiHeavily indebted poor countries (HIPC)High incomeHondurasHungaryIBRD onlyIcelandIDA & IBRD totalIDA blendIDA onlyIDA totalIndiaIndonesiaIran, Islamic Rep.IraqIrelandIsraelItalyJamaicaJapanJordanKazakhstanKenyaKiribatiKorea, Rep.KuwaitKyrgyz RepublicLao PDRLate-demographic dividendLatin America & Caribbean Latin America & Caribbean (excluding high income)Latin America & the Caribbean (IDA & IBRD countries)LatviaLeast developed countries: UN classificationLebanonLesothoLiberiaLibyaLithuaniaLow & middle incomeLow incomeLower middle incomeLuxembourgMacedonia, FYRMadagascarMalawiMalaysiaMaldivesMaliMauritaniaMauritiusMexicoMiddle East & North AfricaMiddle East & North Africa (excluding high income)Middle East & North Africa (IDA & IBRD countries)Middle incomeMoldovaMongoliaMoroccoMozambiqueNamibiaNepalNetherlandsNew ZealandNicaraguaNigerNigeriaNorth AmericaNorwayOECD membersOmanOther small statesPacific island small statesPakistanPanamaPapua New GuineaParaguayPeruPhilippinesPolandPortugalPost-demographic dividendPre-demographic dividendQatarRomaniaRussian FederationRwandaSaudi ArabiaSenegalSeychellesSierra LeoneSingaporeSlovak RepublicSloveniaSmall statesSolomon IslandsSouth AfricaSouth AsiaSouth Asia (IDA & IBRD)SpainSri LankaSt. LuciaSt. Vincent and the GrenadinesSub-Saharan Africa Sub-Saharan Africa (excluding high income)Sub-Saharan Africa (IDA & IBRD countries)SudanSurinameSwazilandSwedenSwitzerlandSyrian Arab RepublicTajikistanTanzaniaThailandTogoTongaTrinidad and TobagoTunisiaTurkeyUgandaUkraineUnited KingdomUnited StatesUpper middle incomeUruguayVanuatuVenezuela, RBVietnamWorldYemen, Rep.ZambiaZimbabwe Timeline:
This timeline shows a graph from 1981 to 2013 of Panama. No data until 1980. Number of actual observations by date: 33.
Source name:
World Development Indicators
Source organization:
World Bank staff estimates based on sources and methods in World Bank's "The Changing Wealth of Nations: Measuring Sustainable Development in the New Millennium" (2011).
Categories, topics:
Economy & Growth, Environment
Last updated:
apr 23, 2017
Indicators value changes by year
Maximum:
37.598
jan 1, 2010
At the date of observation
Value
Absolute change
Change from previous value
jan 1, 1981
26.498
+26.498
0.0%
jan 1, 1982
22.188
-4.31
-16.27%
jan 1, 1983
30.632
+8.444
38.06%
jan 1, 1984
28.24
-2.393
-7.81%
jan 1, 1985
16.69
-11.549
-40.9%
jan 1, 1986
20.211
+3.521
21.1%
jan 1, 1987
18.588
-1.623
-8.03%
jan 1, 1988
27.516
+8.927
48.03%
jan 1, 1989
21.477
-6.039
-21.95%
jan 1, 1990
8.938
-12.539
-58.38%
jan 1, 1991
21.905
+12.967
145.09%
jan 1, 1992
17.812
-4.093
-18.69%
jan 1, 1993
24.006
+6.194
34.77%
jan 1, 1994
25.944
+1.938
8.07%
jan 1, 1995
27.848
+1.904
7.34%
jan 1, 1996
28.227
+0.379
1.36%
jan 1, 1997
23.737
-4.49
-15.91%
jan 1, 1998
24.02
+0.283
1.19%
jan 1, 1999
19.941
-4.08
-16.98%
jan 1, 2000
17.363
-2.577
-12.93%
jan 1, 2001
20.279
+2.916
16.79%
jan 1, 2002
17.816
-2.463
-12.15%
jan 1, 2003
16.351
-1.465
-8.22%
jan 1, 2004
16.274
-0.076
-0.47%
jan 1, 2005
12.966
-3.308
-20.33%
jan 1, 2006
16.034
+3.068
23.66%
jan 1, 2007
29.056
+13.021
81.21%
jan 1, 2008
31.508
+2.452
8.44%
jan 1, 2009
36.126
+4.618
14.66%
jan 1, 2010
37.598
+1.472
4.07%
jan 1, 2011
26.882
-10.715
-28.5%
jan 1, 2012
18.775
-8.107
-30.16%
jan 1, 2013
24.348
+5.573
29.68%
Ranking of countries by current statistics by years


Comments: