29
/
en
AIzaSyAYiBZKx7MnpbEhh9jyipgxe19OcubqV5w
April 1, 2024
26262
Early-demographic dividend
EAR
false
2
1
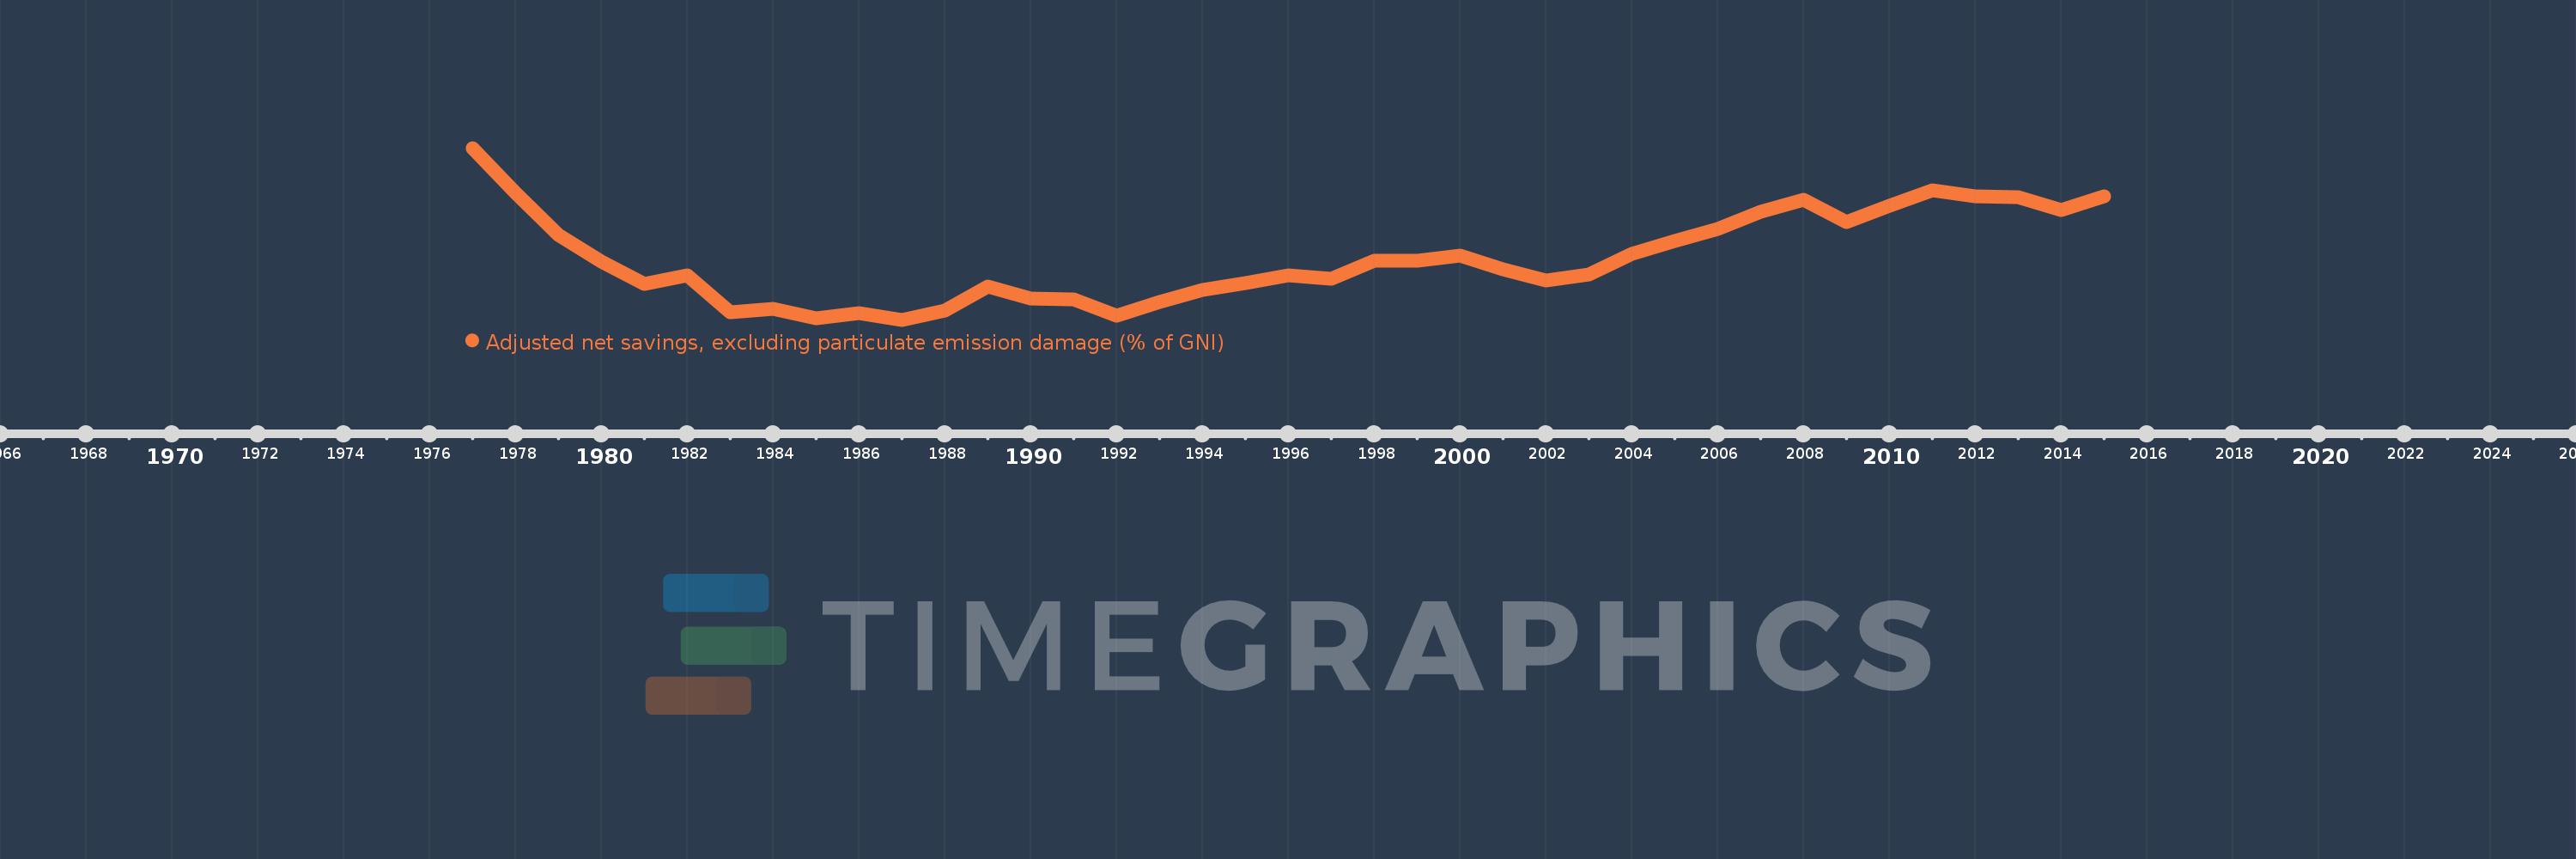
Adjusted net savings, excluding particulate emission damage (% of GNI)
2015,2014,2013,2012,2011,2010,2009,2008,2007,2006,2005,2004,2003,2002,2001,2000,1999,1998,1997,1996,1995,1994,1993,1992,1991,1990,1989,1988,1987,1986,1985,1984,1983,1982,1981,1980,1979,1978,1977
This statistics in other country:
AfghanistanAlbaniaAlgeriaAngolaArab WorldArgentinaArmeniaAustraliaAustriaAzerbaijanBahamas, TheBahrainBangladeshBarbadosBelarusBelgiumBelizeBeninBhutanBoliviaBotswanaBrazilBrunei DarussalamBulgariaBurkina FasoBurundiCabo VerdeCambodiaCameroonCanadaCaribbean small statesCentral African RepublicCentral Europe and the BalticsChadChileChinaColombiaComorosCongo, Dem. Rep.Congo, Rep.Costa RicaCote d'IvoireCroatiaCyprusCzech RepublicDenmarkDjiboutiDominicaDominican RepublicEarly-demographic dividendEast Asia & PacificEast Asia & Pacific (excluding high income)East Asia & Pacific (IDA & IBRD countries)EcuadorEgypt, Arab Rep.El SalvadorEquatorial GuineaEritreaEstoniaEthiopiaEuro areaEurope & Central AsiaEurope & Central Asia (excluding high income)Europe & Central Asia (IDA & IBRD countries)European UnionFijiFinlandFragile and conflict affected situationsFranceGabonGambia, TheGeorgiaGermanyGhanaGreeceGuatemalaGuineaGuinea-BissauGuyanaHaitiHeavily indebted poor countries (HIPC)High incomeHondurasHungaryIBRD onlyIcelandIDA & IBRD totalIDA blendIDA onlyIDA totalIndiaIndonesiaIran, Islamic Rep.IraqIrelandIsraelItalyJamaicaJapanJordanKazakhstanKenyaKiribatiKorea, Rep.KuwaitKyrgyz RepublicLao PDRLate-demographic dividendLatin America & Caribbean Latin America & Caribbean (excluding high income)Latin America & the Caribbean (IDA & IBRD countries)LatviaLeast developed countries: UN classificationLebanonLesothoLiberiaLibyaLithuaniaLow & middle incomeLow incomeLower middle incomeLuxembourgMacedonia, FYRMadagascarMalawiMalaysiaMaldivesMaliMauritaniaMauritiusMexicoMiddle East & North AfricaMiddle East & North Africa (excluding high income)Middle East & North Africa (IDA & IBRD countries)Middle incomeMoldovaMongoliaMoroccoMozambiqueNamibiaNepalNetherlandsNew ZealandNicaraguaNigerNigeriaNorth AmericaNorwayOECD membersOmanOther small statesPacific island small statesPakistanPanamaPapua New GuineaParaguayPeruPhilippinesPolandPortugalPost-demographic dividendPre-demographic dividendQatarRomaniaRussian FederationRwandaSaudi ArabiaSenegalSeychellesSierra LeoneSingaporeSlovak RepublicSloveniaSmall statesSolomon IslandsSouth AfricaSouth AsiaSouth Asia (IDA & IBRD)SpainSri LankaSt. LuciaSt. Vincent and the GrenadinesSub-Saharan Africa Sub-Saharan Africa (excluding high income)Sub-Saharan Africa (IDA & IBRD countries)SudanSurinameSwazilandSwedenSwitzerlandSyrian Arab RepublicTajikistanTanzaniaThailandTogoTongaTrinidad and TobagoTunisiaTurkeyUgandaUkraineUnited KingdomUnited StatesUpper middle incomeUruguayVanuatuVenezuela, RBVietnamWorldYemen, Rep.ZambiaZimbabwe Timeline:
This timeline shows a graph from 1977 to 2015 of Early-demographic dividend. No data until 1976. Number of actual observations by date: 39.
Source name:
World Development Indicators
Source organization:
World Bank staff estimates based on sources and methods in World Bank's "The Changing Wealth of Nations: Measuring Sustainable Development in the New Millennium" (2011).
Categories, topics:
Economy & Growth, Environment
Last updated:
apr 23, 2017
Indicators value changes by year
Maximum:
18.641
jan 1, 1977
At the date of observation
Value
Absolute change
Change from previous value
jan 1, 1977
18.641
+18.641
0.0%
jan 1, 1978
15.653
-2.988
-16.03%
jan 1, 1979
12.887
-2.766
-17.67%
jan 1, 1980
11.131
-1.756
-13.62%
jan 1, 1981
9.637
-1.494
-13.42%
jan 1, 1982
10.219
+0.582
6.04%
jan 1, 1983
7.764
-2.455
-24.02%
jan 1, 1984
7.987
+0.223
2.87%
jan 1, 1985
7.328
-0.659
-8.25%
jan 1, 1986
7.689
+0.361
4.93%
jan 1, 1987
7.257
-0.432
-5.62%
jan 1, 1988
7.869
+0.612
8.44%
jan 1, 1989
9.474
+1.605
20.39%
jan 1, 1990
8.659
-0.815
-8.6%
jan 1, 1991
8.597
-0.062
-0.72%
jan 1, 1992
7.519
-1.078
-12.54%
jan 1, 1993
8.463
+0.945
12.56%
jan 1, 1994
9.255
+0.792
9.35%
jan 1, 1995
9.681
+0.426
4.6%
jan 1, 1996
10.186
+0.505
5.21%
jan 1, 1997
9.98
-0.205
-2.02%
jan 1, 1998
11.139
+1.159
11.62%
jan 1, 1999
11.155
+0.016
0.14%
jan 1, 2000
11.536
+0.381
3.42%
jan 1, 2001
10.621
-0.915
-7.93%
jan 1, 2002
9.855
-0.766
-7.21%
jan 1, 2003
10.264
+0.409
4.15%
jan 1, 2004
11.634
+1.37
13.35%
jan 1, 2005
12.48
+0.846
7.27%
jan 1, 2006
13.276
+0.796
6.38%
jan 1, 2007
14.409
+1.133
8.54%
jan 1, 2008
15.22
+0.811
5.63%
jan 1, 2009
13.755
-1.465
-9.63%
jan 1, 2010
14.79
+1.035
7.53%
jan 1, 2011
15.854
+1.065
7.2%
jan 1, 2012
15.42
-0.434
-2.74%
jan 1, 2013
15.406
-0.014
-0.09%
jan 1, 2014
14.552
-0.854
-5.54%
jan 1, 2015
15.445
+0.893
6.14%
Ranking of countries by current statistics by years


Comments: