29
/
en
AIzaSyAYiBZKx7MnpbEhh9jyipgxe19OcubqV5w
April 1, 2024
35500
High income
HIC
false
2
1
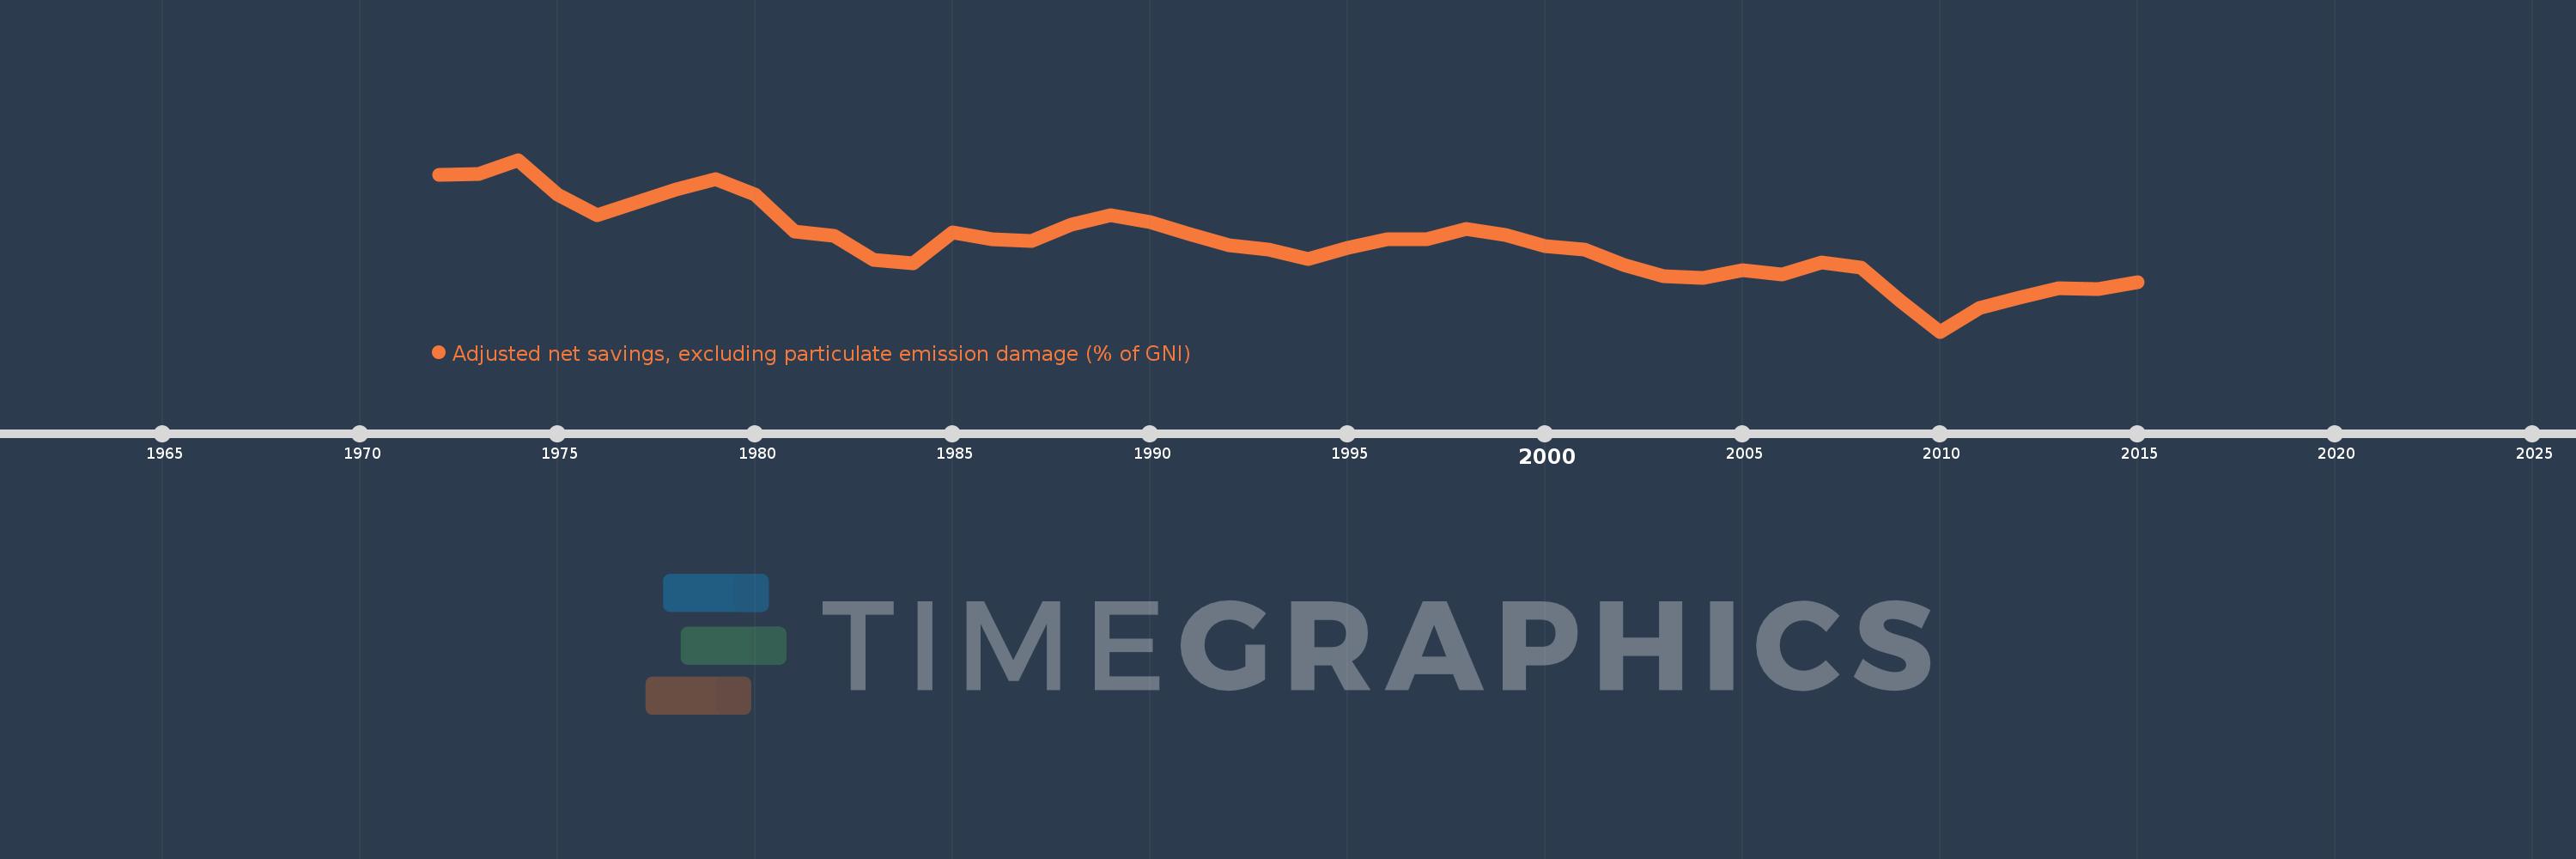
Adjusted net savings, excluding particulate emission damage (% of GNI)
2015,2014,2013,2012,2011,2010,2009,2008,2007,2006,2005,2004,2003,2002,2001,2000,1999,1998,1997,1996,1995,1994,1993,1992,1991,1990,1989,1988,1987,1986,1985,1984,1983,1982,1981,1980,1979,1978,1977,1976,1975,1974,1973,1972
This statistics in other country:
AfghanistanAlbaniaAlgeriaAngolaArab WorldArgentinaArmeniaAustraliaAustriaAzerbaijanBahamas, TheBahrainBangladeshBarbadosBelarusBelgiumBelizeBeninBhutanBoliviaBotswanaBrazilBrunei DarussalamBulgariaBurkina FasoBurundiCabo VerdeCambodiaCameroonCanadaCaribbean small statesCentral African RepublicCentral Europe and the BalticsChadChileChinaColombiaComorosCongo, Dem. Rep.Congo, Rep.Costa RicaCote d'IvoireCroatiaCyprusCzech RepublicDenmarkDjiboutiDominicaDominican RepublicEarly-demographic dividendEast Asia & PacificEast Asia & Pacific (excluding high income)East Asia & Pacific (IDA & IBRD countries)EcuadorEgypt, Arab Rep.El SalvadorEquatorial GuineaEritreaEstoniaEthiopiaEuro areaEurope & Central AsiaEurope & Central Asia (excluding high income)Europe & Central Asia (IDA & IBRD countries)European UnionFijiFinlandFragile and conflict affected situationsFranceGabonGambia, TheGeorgiaGermanyGhanaGreeceGuatemalaGuineaGuinea-BissauGuyanaHaitiHeavily indebted poor countries (HIPC)High incomeHondurasHungaryIBRD onlyIcelandIDA & IBRD totalIDA blendIDA onlyIDA totalIndiaIndonesiaIran, Islamic Rep.IraqIrelandIsraelItalyJamaicaJapanJordanKazakhstanKenyaKiribatiKorea, Rep.KuwaitKyrgyz RepublicLao PDRLate-demographic dividendLatin America & Caribbean Latin America & Caribbean (excluding high income)Latin America & the Caribbean (IDA & IBRD countries)LatviaLeast developed countries: UN classificationLebanonLesothoLiberiaLibyaLithuaniaLow & middle incomeLow incomeLower middle incomeLuxembourgMacedonia, FYRMadagascarMalawiMalaysiaMaldivesMaliMauritaniaMauritiusMexicoMiddle East & North AfricaMiddle East & North Africa (excluding high income)Middle East & North Africa (IDA & IBRD countries)Middle incomeMoldovaMongoliaMoroccoMozambiqueNamibiaNepalNetherlandsNew ZealandNicaraguaNigerNigeriaNorth AmericaNorwayOECD membersOmanOther small statesPacific island small statesPakistanPanamaPapua New GuineaParaguayPeruPhilippinesPolandPortugalPost-demographic dividendPre-demographic dividendQatarRomaniaRussian FederationRwandaSaudi ArabiaSenegalSeychellesSierra LeoneSingaporeSlovak RepublicSloveniaSmall statesSolomon IslandsSouth AfricaSouth AsiaSouth Asia (IDA & IBRD)SpainSri LankaSt. LuciaSt. Vincent and the GrenadinesSub-Saharan Africa Sub-Saharan Africa (excluding high income)Sub-Saharan Africa (IDA & IBRD countries)SudanSurinameSwazilandSwedenSwitzerlandSyrian Arab RepublicTajikistanTanzaniaThailandTogoTongaTrinidad and TobagoTunisiaTurkeyUgandaUkraineUnited KingdomUnited StatesUpper middle incomeUruguayVanuatuVenezuela, RBVietnamWorldYemen, Rep.ZambiaZimbabwe Timeline:
This timeline shows a graph from 1972 to 2015 of High income. No data until 1971. Number of actual observations by date: 44.
Source name:
World Development Indicators
Source organization:
World Bank staff estimates based on sources and methods in World Bank's "The Changing Wealth of Nations: Measuring Sustainable Development in the New Millennium" (2011).
Categories, topics:
Economy & Growth, Environment
Last updated:
apr 23, 2017
Indicators value changes by year
Maximum:
15.932
jan 1, 1974
At the date of observation
Value
Absolute change
Change from previous value
jan 1, 1972
14.996
+14.996
0.0%
jan 1, 1973
15.046
+0.05
0.33%
jan 1, 1974
15.932
+0.887
5.9%
jan 1, 1975
13.789
-2.143
-13.45%
jan 1, 1976
12.533
-1.256
-9.11%
jan 1, 1977
13.31
+0.776
6.19%
jan 1, 1978
14.133
+0.823
6.19%
jan 1, 1979
14.762
+0.629
4.45%
jan 1, 1980
13.804
-0.958
-6.49%
jan 1, 1981
11.548
-2.256
-16.34%
jan 1, 1982
11.299
-0.249
-2.16%
jan 1, 1983
9.814
-1.485
-13.15%
jan 1, 1984
9.615
-0.199
-2.02%
jan 1, 1985
11.482
+1.867
19.42%
jan 1, 1986
11.062
-0.42
-3.66%
jan 1, 1987
10.984
-0.078
-0.71%
jan 1, 1988
11.968
+0.984
8.96%
jan 1, 1989
12.516
+0.548
4.58%
jan 1, 1990
12.103
-0.413
-3.3%
jan 1, 1991
11.358
-0.745
-6.16%
jan 1, 1992
10.676
-0.682
-6.01%
jan 1, 1993
10.416
-0.26
-2.43%
jan 1, 1994
9.867
-0.549
-5.27%
jan 1, 1995
10.529
+0.663
6.72%
jan 1, 1996
11.092
+0.563
5.35%
jan 1, 1997
11.092
-0.001
-0.01%
jan 1, 1998
11.719
+0.628
5.66%
jan 1, 1999
11.357
-0.363
-3.09%
jan 1, 2000
10.644
-0.713
-6.28%
jan 1, 2001
10.461
-0.183
-1.72%
jan 1, 2002
9.514
-0.947
-9.05%
jan 1, 2003
8.833
-0.682
-7.16%
jan 1, 2004
8.728
-0.105
-1.19%
jan 1, 2005
9.199
+0.471
5.39%
jan 1, 2006
8.922
-0.277
-3.01%
jan 1, 2007
9.649
+0.727
8.15%
jan 1, 2008
9.359
-0.29
-3.01%
jan 1, 2009
7.296
-2.063
-22.04%
jan 1, 2010
5.416
-1.88
-25.76%
jan 1, 2011
6.84
+1.424
26.29%
jan 1, 2012
7.477
+0.637
9.31%
jan 1, 2013
8.049
+0.572
7.65%
jan 1, 2014
8.014
-0.035
-0.43%
jan 1, 2015
8.419
+0.405
5.05%
Ranking of countries by current statistics by years


Comments: