29
/
en
AIzaSyAYiBZKx7MnpbEhh9jyipgxe19OcubqV5w
April 1, 2024
247229
Spain
ESP
true
2
1
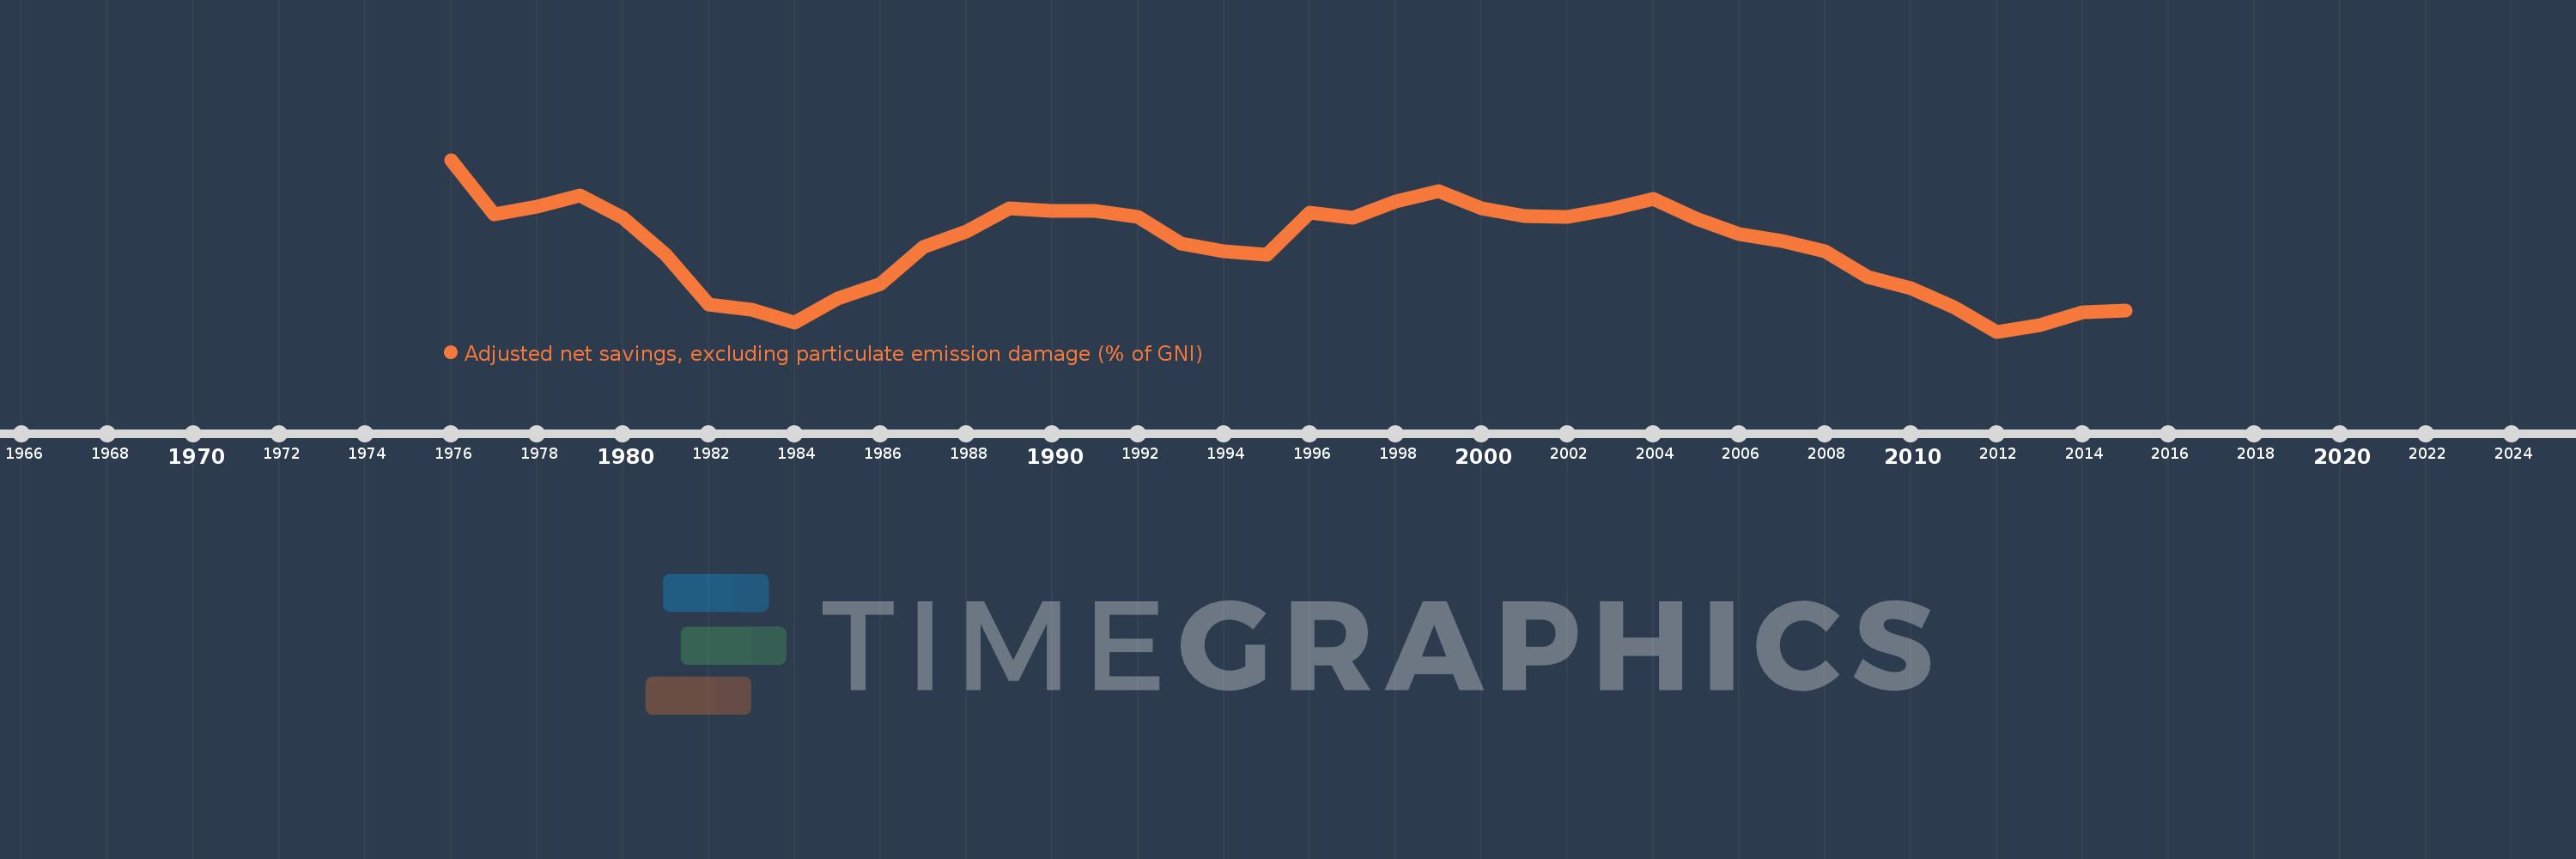
Adjusted net savings, excluding particulate emission damage (% of GNI)
2015,2014,2013,2012,2011,2010,2009,2008,2007,2006,2005,2004,2003,2002,2001,2000,1999,1998,1997,1996,1995,1994,1993,1992,1991,1990,1989,1988,1987,1986,1985,1984,1983,1982,1981,1980,1979,1978,1977,1976
This statistics in other country:
AfghanistanAlbaniaAlgeriaAngolaArab WorldArgentinaArmeniaAustraliaAustriaAzerbaijanBahamas, TheBahrainBangladeshBarbadosBelarusBelgiumBelizeBeninBhutanBoliviaBotswanaBrazilBrunei DarussalamBulgariaBurkina FasoBurundiCabo VerdeCambodiaCameroonCanadaCaribbean small statesCentral African RepublicCentral Europe and the BalticsChadChileChinaColombiaComorosCongo, Dem. Rep.Congo, Rep.Costa RicaCote d'IvoireCroatiaCyprusCzech RepublicDenmarkDjiboutiDominicaDominican RepublicEarly-demographic dividendEast Asia & PacificEast Asia & Pacific (excluding high income)East Asia & Pacific (IDA & IBRD countries)EcuadorEgypt, Arab Rep.El SalvadorEquatorial GuineaEritreaEstoniaEthiopiaEuro areaEurope & Central AsiaEurope & Central Asia (excluding high income)Europe & Central Asia (IDA & IBRD countries)European UnionFijiFinlandFragile and conflict affected situationsFranceGabonGambia, TheGeorgiaGermanyGhanaGreeceGuatemalaGuineaGuinea-BissauGuyanaHaitiHeavily indebted poor countries (HIPC)High incomeHondurasHungaryIBRD onlyIcelandIDA & IBRD totalIDA blendIDA onlyIDA totalIndiaIndonesiaIran, Islamic Rep.IraqIrelandIsraelItalyJamaicaJapanJordanKazakhstanKenyaKiribatiKorea, Rep.KuwaitKyrgyz RepublicLao PDRLate-demographic dividendLatin America & Caribbean Latin America & Caribbean (excluding high income)Latin America & the Caribbean (IDA & IBRD countries)LatviaLeast developed countries: UN classificationLebanonLesothoLiberiaLibyaLithuaniaLow & middle incomeLow incomeLower middle incomeLuxembourgMacedonia, FYRMadagascarMalawiMalaysiaMaldivesMaliMauritaniaMauritiusMexicoMiddle East & North AfricaMiddle East & North Africa (excluding high income)Middle East & North Africa (IDA & IBRD countries)Middle incomeMoldovaMongoliaMoroccoMozambiqueNamibiaNepalNetherlandsNew ZealandNicaraguaNigerNigeriaNorth AmericaNorwayOECD membersOmanOther small statesPacific island small statesPakistanPanamaPapua New GuineaParaguayPeruPhilippinesPolandPortugalPost-demographic dividendPre-demographic dividendQatarRomaniaRussian FederationRwandaSaudi ArabiaSenegalSeychellesSierra LeoneSingaporeSlovak RepublicSloveniaSmall statesSolomon IslandsSouth AfricaSouth AsiaSouth Asia (IDA & IBRD)SpainSri LankaSt. LuciaSt. Vincent and the GrenadinesSub-Saharan Africa Sub-Saharan Africa (excluding high income)Sub-Saharan Africa (IDA & IBRD countries)SudanSurinameSwazilandSwedenSwitzerlandSyrian Arab RepublicTajikistanTanzaniaThailandTogoTongaTrinidad and TobagoTunisiaTurkeyUgandaUkraineUnited KingdomUnited StatesUpper middle incomeUruguayVanuatuVenezuela, RBVietnamWorldYemen, Rep.ZambiaZimbabwe Timeline:
This timeline shows a graph from 1976 to 2015 of Spain. No data until 1975. Number of actual observations by date: 40.
Source name:
World Development Indicators
Source organization:
World Bank staff estimates based on sources and methods in World Bank's "The Changing Wealth of Nations: Measuring Sustainable Development in the New Millennium" (2011).
Categories, topics:
Economy & Growth, Environment
Last updated:
apr 23, 2017
Indicators value changes by year
Maximum:
15.723
jan 1, 1976
At the date of observation
Value
Absolute change
Change from previous value
jan 1, 1976
15.723
+15.723
0.0%
jan 1, 1977
12.476
-3.247
-20.65%
jan 1, 1978
12.929
+0.453
3.63%
jan 1, 1979
13.606
+0.676
5.23%
jan 1, 1980
12.284
-1.321
-9.71%
jan 1, 1981
10.096
-2.189
-17.82%
jan 1, 1982
7.163
-2.932
-29.04%
jan 1, 1983
6.881
-0.282
-3.94%
jan 1, 1984
6.07
-0.811
-11.79%
jan 1, 1985
7.542
+1.472
24.25%
jan 1, 1986
8.358
+0.816
10.82%
jan 1, 1987
10.544
+2.186
26.15%
jan 1, 1988
11.483
+0.939
8.9%
jan 1, 1989
12.835
+1.352
11.78%
jan 1, 1990
12.694
-0.141
-1.1%
jan 1, 1991
12.716
+0.022
0.17%
jan 1, 1992
12.349
-0.367
-2.88%
jan 1, 1993
10.766
-1.583
-12.82%
jan 1, 1994
10.331
-0.434
-4.03%
jan 1, 1995
10.096
-0.236
-2.28%
jan 1, 1996
12.602
+2.506
24.82%
jan 1, 1997
12.313
-0.289
-2.29%
jan 1, 1998
13.269
+0.957
7.77%
jan 1, 1999
13.877
+0.608
4.58%
jan 1, 2000
12.875
-1.002
-7.22%
jan 1, 2001
12.409
-0.465
-3.61%
jan 1, 2002
12.322
-0.088
-0.71%
jan 1, 2003
12.824
+0.502
4.08%
jan 1, 2004
13.405
+0.582
4.53%
jan 1, 2005
12.247
-1.158
-8.64%
jan 1, 2006
11.352
-0.895
-7.31%
jan 1, 2007
10.904
-0.448
-3.95%
jan 1, 2008
10.319
-0.585
-5.37%
jan 1, 2009
8.811
-1.508
-14.61%
jan 1, 2010
8.14
-0.671
-7.62%
jan 1, 2011
7.003
-1.137
-13.97%
jan 1, 2012
5.561
-1.441
-20.58%
jan 1, 2013
5.942
+0.38
6.84%
jan 1, 2014
6.719
+0.777
13.08%
jan 1, 2015
6.784
+0.065
0.97%
Ranking of countries by current statistics by years


Comments: