29
/
en
AIzaSyAYiBZKx7MnpbEhh9jyipgxe19OcubqV5w
April 1, 2024
79150
Barbados
BRB
true
2
1
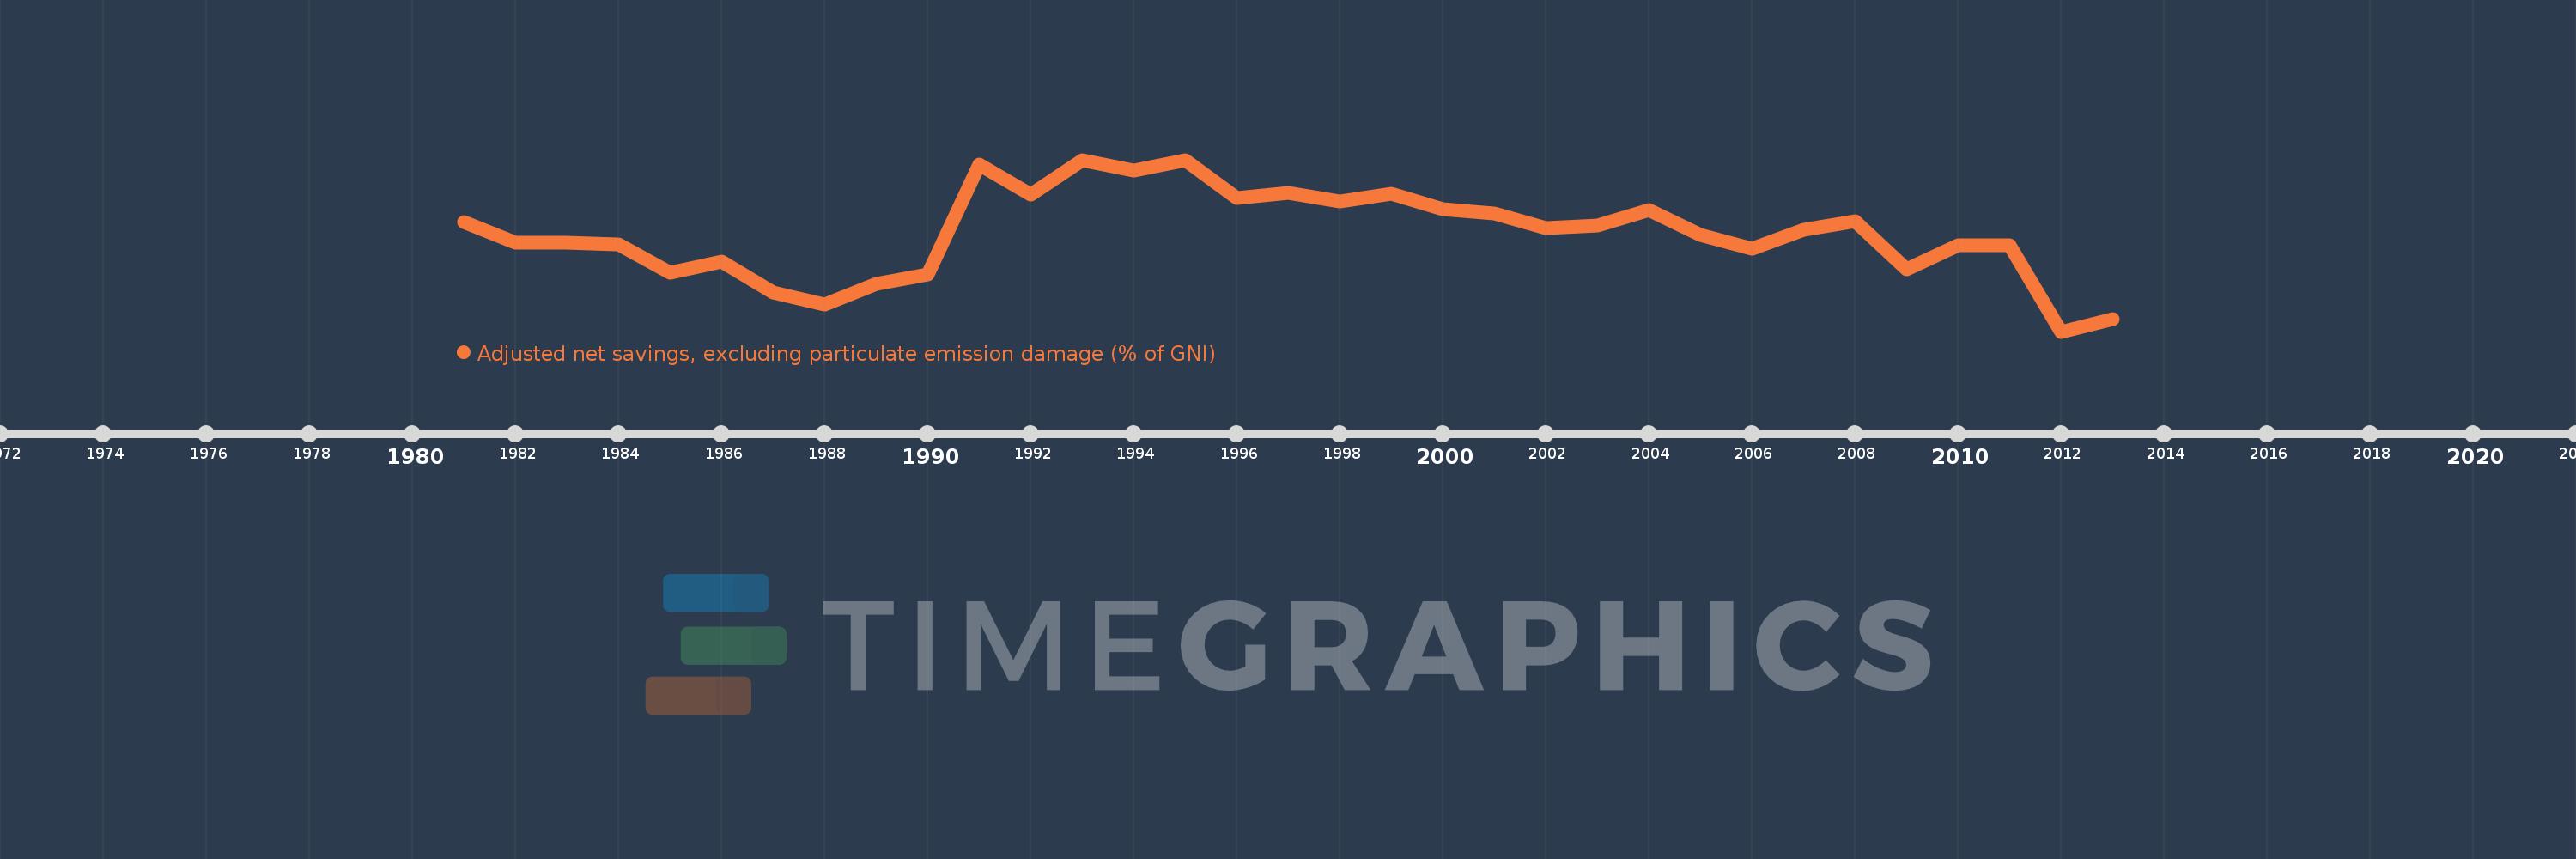
Adjusted net savings, excluding particulate emission damage (% of GNI)
2013,2012,2011,2010,2009,2008,2007,2006,2005,2004,2003,2002,2001,2000,1999,1998,1997,1996,1995,1994,1993,1992,1991,1990,1989,1988,1987,1986,1985,1984,1983,1982,1981
This statistics in other country:
AfghanistanAlbaniaAlgeriaAngolaArab WorldArgentinaArmeniaAustraliaAustriaAzerbaijanBahamas, TheBahrainBangladeshBarbadosBelarusBelgiumBelizeBeninBhutanBoliviaBotswanaBrazilBrunei DarussalamBulgariaBurkina FasoBurundiCabo VerdeCambodiaCameroonCanadaCaribbean small statesCentral African RepublicCentral Europe and the BalticsChadChileChinaColombiaComorosCongo, Dem. Rep.Congo, Rep.Costa RicaCote d'IvoireCroatiaCyprusCzech RepublicDenmarkDjiboutiDominicaDominican RepublicEarly-demographic dividendEast Asia & PacificEast Asia & Pacific (excluding high income)East Asia & Pacific (IDA & IBRD countries)EcuadorEgypt, Arab Rep.El SalvadorEquatorial GuineaEritreaEstoniaEthiopiaEuro areaEurope & Central AsiaEurope & Central Asia (excluding high income)Europe & Central Asia (IDA & IBRD countries)European UnionFijiFinlandFragile and conflict affected situationsFranceGabonGambia, TheGeorgiaGermanyGhanaGreeceGuatemalaGuineaGuinea-BissauGuyanaHaitiHeavily indebted poor countries (HIPC)High incomeHondurasHungaryIBRD onlyIcelandIDA & IBRD totalIDA blendIDA onlyIDA totalIndiaIndonesiaIran, Islamic Rep.IraqIrelandIsraelItalyJamaicaJapanJordanKazakhstanKenyaKiribatiKorea, Rep.KuwaitKyrgyz RepublicLao PDRLate-demographic dividendLatin America & Caribbean Latin America & Caribbean (excluding high income)Latin America & the Caribbean (IDA & IBRD countries)LatviaLeast developed countries: UN classificationLebanonLesothoLiberiaLibyaLithuaniaLow & middle incomeLow incomeLower middle incomeLuxembourgMacedonia, FYRMadagascarMalawiMalaysiaMaldivesMaliMauritaniaMauritiusMexicoMiddle East & North AfricaMiddle East & North Africa (excluding high income)Middle East & North Africa (IDA & IBRD countries)Middle incomeMoldovaMongoliaMoroccoMozambiqueNamibiaNepalNetherlandsNew ZealandNicaraguaNigerNigeriaNorth AmericaNorwayOECD membersOmanOther small statesPacific island small statesPakistanPanamaPapua New GuineaParaguayPeruPhilippinesPolandPortugalPost-demographic dividendPre-demographic dividendQatarRomaniaRussian FederationRwandaSaudi ArabiaSenegalSeychellesSierra LeoneSingaporeSlovak RepublicSloveniaSmall statesSolomon IslandsSouth AfricaSouth AsiaSouth Asia (IDA & IBRD)SpainSri LankaSt. LuciaSt. Vincent and the GrenadinesSub-Saharan Africa Sub-Saharan Africa (excluding high income)Sub-Saharan Africa (IDA & IBRD countries)SudanSurinameSwazilandSwedenSwitzerlandSyrian Arab RepublicTajikistanTanzaniaThailandTogoTongaTrinidad and TobagoTunisiaTurkeyUgandaUkraineUnited KingdomUnited StatesUpper middle incomeUruguayVanuatuVenezuela, RBVietnamWorldYemen, Rep.ZambiaZimbabwe Timeline:
This timeline shows a graph from 1981 to 2013 of Barbados. No data until 1980. Number of actual observations by date: 33.
Source name:
World Development Indicators
Source organization:
World Bank staff estimates based on sources and methods in World Bank's "The Changing Wealth of Nations: Measuring Sustainable Development in the New Millennium" (2011).
Categories, topics:
Economy & Growth, Environment
Last updated:
apr 23, 2017
Indicators value changes by year
Minimum:
-1.809
jan 1, 2012
Maximum:
21.863
jan 1, 1995
At the date of observation
Value
Absolute change
Change from previous value
jan 1, 1981
13.24
+13.24
0.0%
jan 1, 1982
10.39
-2.85
-21.52%
jan 1, 1983
10.393
+0.003
0.02%
jan 1, 1984
10.153
-0.24
-2.31%
jan 1, 1985
6.261
-3.892
-38.34%
jan 1, 1986
7.818
+1.557
24.87%
jan 1, 1987
3.56
-4.257
-54.46%
jan 1, 1988
1.965
-1.595
-44.8%
jan 1, 1989
4.704
+2.739
139.34%
jan 1, 1990
6.078
+1.374
29.21%
jan 1, 1991
21.191
+15.113
248.65%
jan 1, 1992
17.045
-4.146
-19.56%
jan 1, 1993
21.841
+4.796
28.14%
jan 1, 1994
20.374
-1.466
-6.71%
jan 1, 1995
21.863
+1.489
7.31%
jan 1, 1996
16.619
-5.244
-23.99%
jan 1, 1997
17.31
+0.691
4.16%
jan 1, 1998
16.09
-1.22
-7.05%
jan 1, 1999
17.197
+1.107
6.88%
jan 1, 2000
15.038
-2.159
-12.56%
jan 1, 2001
14.44
-0.597
-3.97%
jan 1, 2002
12.418
-2.022
-14.0%
jan 1, 2003
12.797
+0.379
3.05%
jan 1, 2004
14.962
+2.165
16.92%
jan 1, 2005
11.497
-3.464
-23.16%
jan 1, 2006
9.643
-1.854
-16.13%
jan 1, 2007
12.27
+2.626
27.23%
jan 1, 2008
13.372
+1.102
8.99%
jan 1, 2009
6.772
-6.6
-49.36%
jan 1, 2010
10.102
+3.33
49.18%
jan 1, 2011
10.083
-0.019
-0.19%
jan 1, 2012
-1.809
-11.892
-117.94%
jan 1, 2013
-0.039
+1.77
-97.82%
Ranking of countries by current statistics by years


Comments: