29
/
en
AIzaSyAYiBZKx7MnpbEhh9jyipgxe19OcubqV5w
April 1, 2024
46817
Lower middle income
LMC
false
2
1
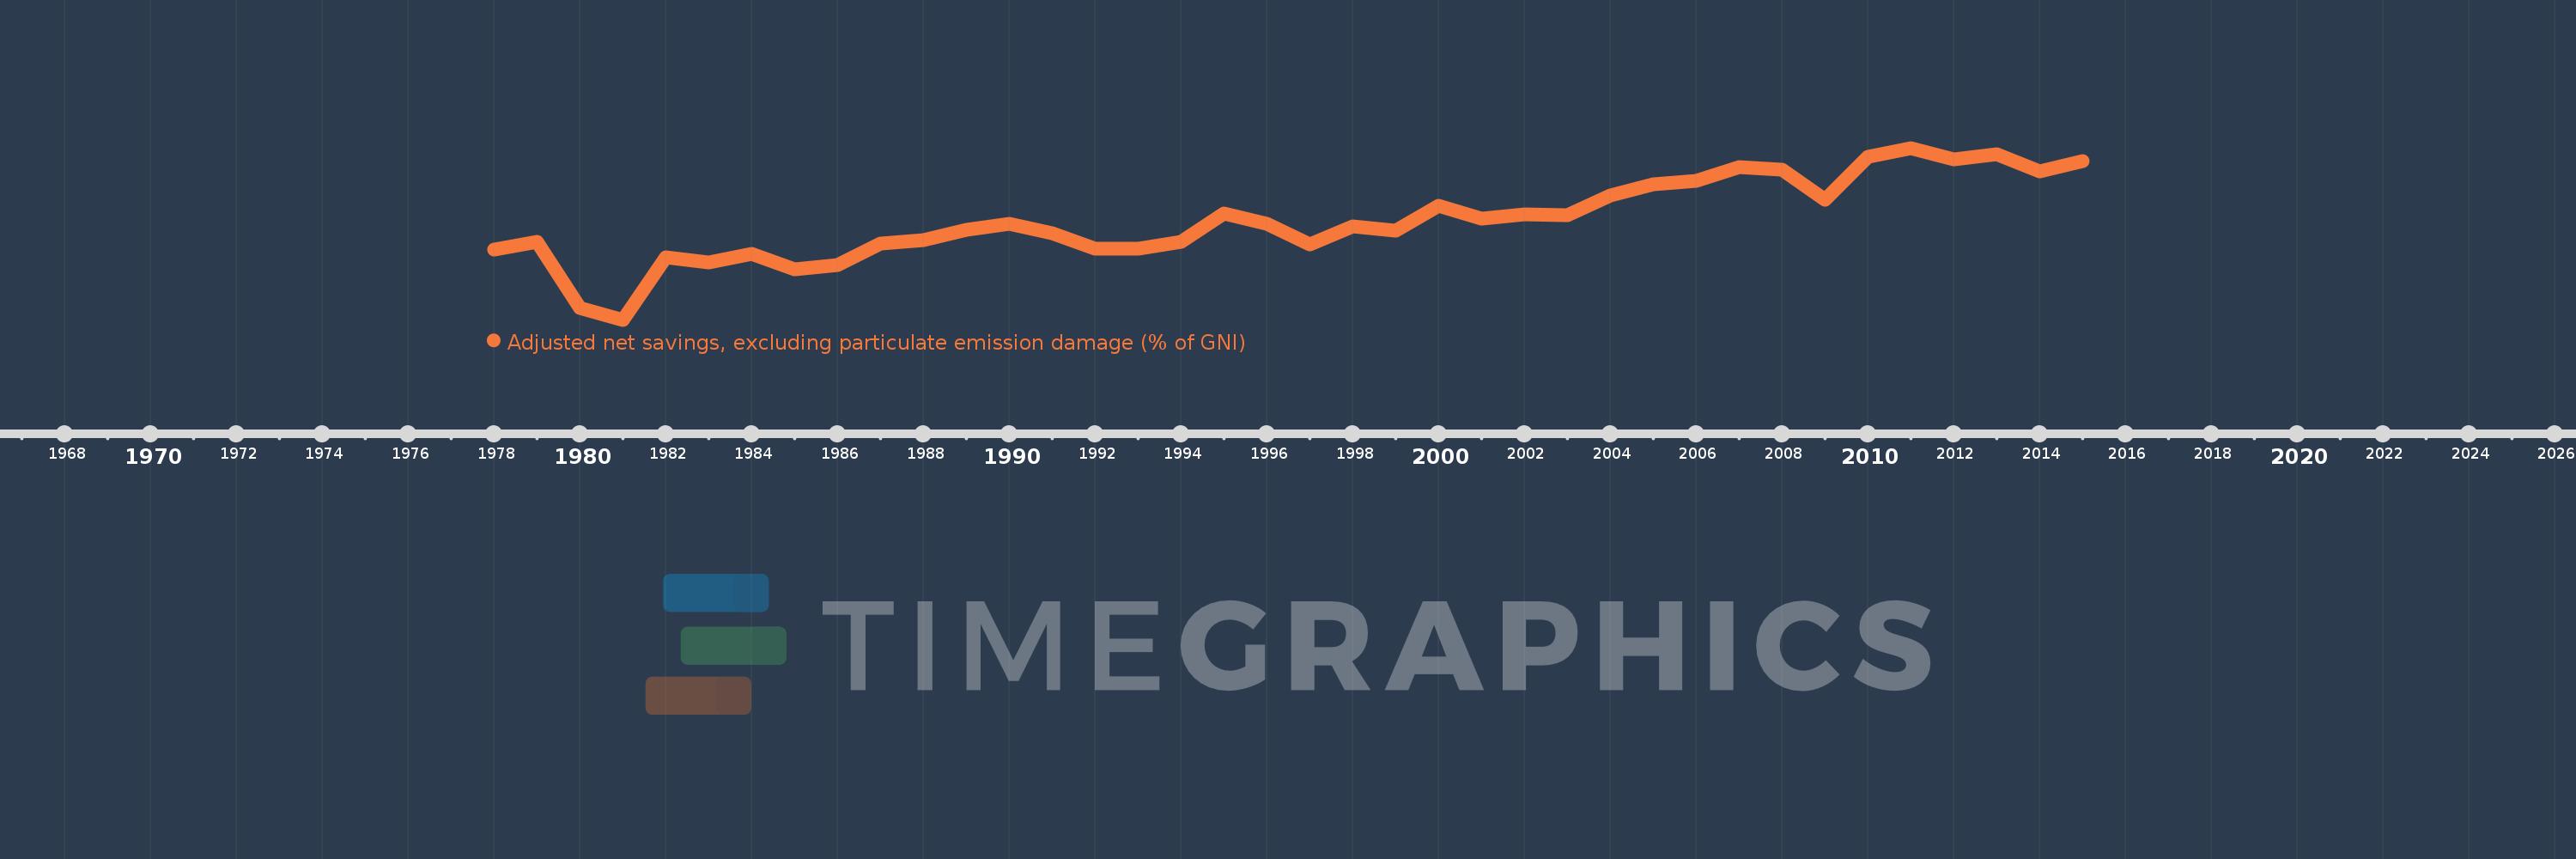
Adjusted net savings, excluding particulate emission damage (% of GNI)
2015,2014,2013,2012,2011,2010,2009,2008,2007,2006,2005,2004,2003,2002,2001,2000,1999,1998,1997,1996,1995,1994,1993,1992,1991,1990,1989,1988,1987,1986,1985,1984,1983,1982,1981,1980,1979,1978
This statistics in other country:
AfghanistanAlbaniaAlgeriaAngolaArab WorldArgentinaArmeniaAustraliaAustriaAzerbaijanBahamas, TheBahrainBangladeshBarbadosBelarusBelgiumBelizeBeninBhutanBoliviaBotswanaBrazilBrunei DarussalamBulgariaBurkina FasoBurundiCabo VerdeCambodiaCameroonCanadaCaribbean small statesCentral African RepublicCentral Europe and the BalticsChadChileChinaColombiaComorosCongo, Dem. Rep.Congo, Rep.Costa RicaCote d'IvoireCroatiaCyprusCzech RepublicDenmarkDjiboutiDominicaDominican RepublicEarly-demographic dividendEast Asia & PacificEast Asia & Pacific (excluding high income)East Asia & Pacific (IDA & IBRD countries)EcuadorEgypt, Arab Rep.El SalvadorEquatorial GuineaEritreaEstoniaEthiopiaEuro areaEurope & Central AsiaEurope & Central Asia (excluding high income)Europe & Central Asia (IDA & IBRD countries)European UnionFijiFinlandFragile and conflict affected situationsFranceGabonGambia, TheGeorgiaGermanyGhanaGreeceGuatemalaGuineaGuinea-BissauGuyanaHaitiHeavily indebted poor countries (HIPC)High incomeHondurasHungaryIBRD onlyIcelandIDA & IBRD totalIDA blendIDA onlyIDA totalIndiaIndonesiaIran, Islamic Rep.IraqIrelandIsraelItalyJamaicaJapanJordanKazakhstanKenyaKiribatiKorea, Rep.KuwaitKyrgyz RepublicLao PDRLate-demographic dividendLatin America & Caribbean Latin America & Caribbean (excluding high income)Latin America & the Caribbean (IDA & IBRD countries)LatviaLeast developed countries: UN classificationLebanonLesothoLiberiaLibyaLithuaniaLow & middle incomeLow incomeLower middle incomeLuxembourgMacedonia, FYRMadagascarMalawiMalaysiaMaldivesMaliMauritaniaMauritiusMexicoMiddle East & North AfricaMiddle East & North Africa (excluding high income)Middle East & North Africa (IDA & IBRD countries)Middle incomeMoldovaMongoliaMoroccoMozambiqueNamibiaNepalNetherlandsNew ZealandNicaraguaNigerNigeriaNorth AmericaNorwayOECD membersOmanOther small statesPacific island small statesPakistanPanamaPapua New GuineaParaguayPeruPhilippinesPolandPortugalPost-demographic dividendPre-demographic dividendQatarRomaniaRussian FederationRwandaSaudi ArabiaSenegalSeychellesSierra LeoneSingaporeSlovak RepublicSloveniaSmall statesSolomon IslandsSouth AfricaSouth AsiaSouth Asia (IDA & IBRD)SpainSri LankaSt. LuciaSt. Vincent and the GrenadinesSub-Saharan Africa Sub-Saharan Africa (excluding high income)Sub-Saharan Africa (IDA & IBRD countries)SudanSurinameSwazilandSwedenSwitzerlandSyrian Arab RepublicTajikistanTanzaniaThailandTogoTongaTrinidad and TobagoTunisiaTurkeyUgandaUkraineUnited KingdomUnited StatesUpper middle incomeUruguayVanuatuVenezuela, RBVietnamWorldYemen, Rep.ZambiaZimbabwe Timeline:
This timeline shows a graph from 1978 to 2015 of Lower middle income. No data until 1977. Number of actual observations by date: 38.
Source name:
World Development Indicators
Source organization:
World Bank staff estimates based on sources and methods in World Bank's "The Changing Wealth of Nations: Measuring Sustainable Development in the New Millennium" (2011).
Categories, topics:
Economy & Growth, Environment
Last updated:
apr 23, 2017
Indicators value changes by year
At the date of observation
Value
Absolute change
Change from previous value
jan 1, 1978
9.269
+9.269
0.0%
jan 1, 1979
9.967
+0.699
7.54%
jan 1, 1980
3.595
-6.373
-63.94%
jan 1, 1981
2.5
-1.094
-30.44%
jan 1, 1982
8.497
+5.996
239.82%
jan 1, 1983
8.053
-0.444
-5.23%
jan 1, 1984
8.825
+0.772
9.59%
jan 1, 1985
7.353
-1.472
-16.68%
jan 1, 1986
7.725
+0.372
5.06%
jan 1, 1987
9.807
+2.082
26.96%
jan 1, 1988
10.174
+0.367
3.74%
jan 1, 1989
11.156
+0.982
9.66%
jan 1, 1990
11.702
+0.546
4.89%
jan 1, 1991
10.83
-0.872
-7.45%
jan 1, 1992
9.305
-1.525
-14.08%
jan 1, 1993
9.367
+0.061
0.66%
jan 1, 1994
9.967
+0.6
6.41%
jan 1, 1995
12.727
+2.76
27.69%
jan 1, 1996
11.7
-1.027
-8.07%
jan 1, 1997
9.726
-1.973
-16.87%
jan 1, 1998
11.451
+1.725
17.73%
jan 1, 1999
11.066
-0.386
-3.37%
jan 1, 2000
13.452
+2.387
21.57%
jan 1, 2001
12.26
-1.192
-8.86%
jan 1, 2002
12.671
+0.411
3.35%
jan 1, 2003
12.535
-0.136
-1.07%
jan 1, 2004
14.461
+1.926
15.36%
jan 1, 2005
15.567
+1.106
7.65%
jan 1, 2006
15.892
+0.325
2.09%
jan 1, 2007
17.188
+1.296
8.16%
jan 1, 2008
16.93
-0.258
-1.5%
jan 1, 2009
14.084
-2.846
-16.81%
jan 1, 2010
18.163
+4.08
28.97%
jan 1, 2011
19.03
+0.866
4.77%
jan 1, 2012
17.9
-1.129
-5.94%
jan 1, 2013
18.464
+0.564
3.15%
jan 1, 2014
16.804
-1.66
-8.99%
jan 1, 2015
17.794
+0.99
5.89%
Ranking of countries by current statistics by years


Comments: