29
/
en
AIzaSyAYiBZKx7MnpbEhh9jyipgxe19OcubqV5w
April 1, 2024
219255
Papua New Guinea
PNG
true
2
1
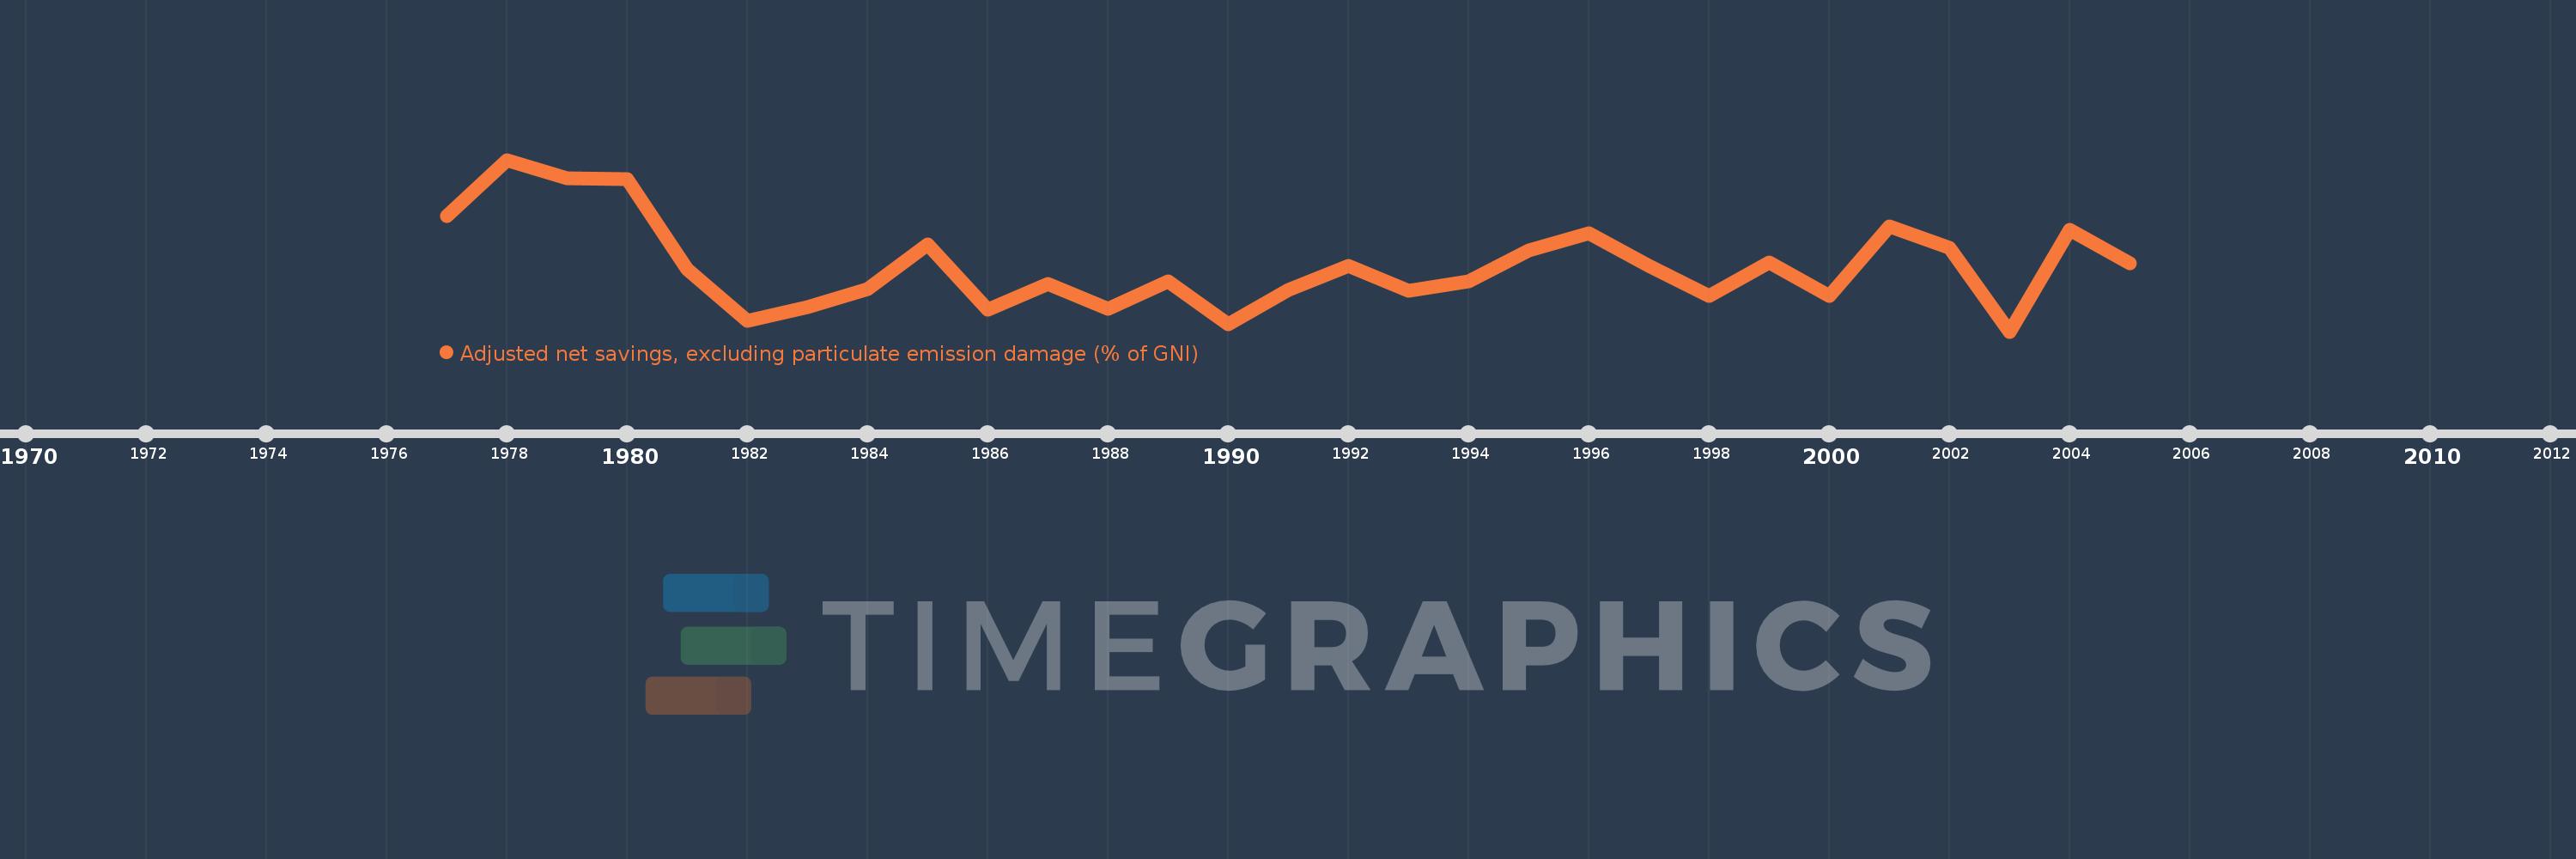
Adjusted net savings, excluding particulate emission damage (% of GNI)
2005,2004,2003,2002,2001,2000,1999,1998,1997,1996,1995,1994,1993,1992,1991,1990,1989,1988,1987,1986,1985,1984,1983,1982,1981,1980,1979,1978,1977
This statistics in other country:
AfghanistanAlbaniaAlgeriaAngolaArab WorldArgentinaArmeniaAustraliaAustriaAzerbaijanBahamas, TheBahrainBangladeshBarbadosBelarusBelgiumBelizeBeninBhutanBoliviaBotswanaBrazilBrunei DarussalamBulgariaBurkina FasoBurundiCabo VerdeCambodiaCameroonCanadaCaribbean small statesCentral African RepublicCentral Europe and the BalticsChadChileChinaColombiaComorosCongo, Dem. Rep.Congo, Rep.Costa RicaCote d'IvoireCroatiaCyprusCzech RepublicDenmarkDjiboutiDominicaDominican RepublicEarly-demographic dividendEast Asia & PacificEast Asia & Pacific (excluding high income)East Asia & Pacific (IDA & IBRD countries)EcuadorEgypt, Arab Rep.El SalvadorEquatorial GuineaEritreaEstoniaEthiopiaEuro areaEurope & Central AsiaEurope & Central Asia (excluding high income)Europe & Central Asia (IDA & IBRD countries)European UnionFijiFinlandFragile and conflict affected situationsFranceGabonGambia, TheGeorgiaGermanyGhanaGreeceGuatemalaGuineaGuinea-BissauGuyanaHaitiHeavily indebted poor countries (HIPC)High incomeHondurasHungaryIBRD onlyIcelandIDA & IBRD totalIDA blendIDA onlyIDA totalIndiaIndonesiaIran, Islamic Rep.IraqIrelandIsraelItalyJamaicaJapanJordanKazakhstanKenyaKiribatiKorea, Rep.KuwaitKyrgyz RepublicLao PDRLate-demographic dividendLatin America & Caribbean Latin America & Caribbean (excluding high income)Latin America & the Caribbean (IDA & IBRD countries)LatviaLeast developed countries: UN classificationLebanonLesothoLiberiaLibyaLithuaniaLow & middle incomeLow incomeLower middle incomeLuxembourgMacedonia, FYRMadagascarMalawiMalaysiaMaldivesMaliMauritaniaMauritiusMexicoMiddle East & North AfricaMiddle East & North Africa (excluding high income)Middle East & North Africa (IDA & IBRD countries)Middle incomeMoldovaMongoliaMoroccoMozambiqueNamibiaNepalNetherlandsNew ZealandNicaraguaNigerNigeriaNorth AmericaNorwayOECD membersOmanOther small statesPacific island small statesPakistanPanamaPapua New GuineaParaguayPeruPhilippinesPolandPortugalPost-demographic dividendPre-demographic dividendQatarRomaniaRussian FederationRwandaSaudi ArabiaSenegalSeychellesSierra LeoneSingaporeSlovak RepublicSloveniaSmall statesSolomon IslandsSouth AfricaSouth AsiaSouth Asia (IDA & IBRD)SpainSri LankaSt. LuciaSt. Vincent and the GrenadinesSub-Saharan Africa Sub-Saharan Africa (excluding high income)Sub-Saharan Africa (IDA & IBRD countries)SudanSurinameSwazilandSwedenSwitzerlandSyrian Arab RepublicTajikistanTanzaniaThailandTogoTongaTrinidad and TobagoTunisiaTurkeyUgandaUkraineUnited KingdomUnited StatesUpper middle incomeUruguayVanuatuVenezuela, RBVietnamWorldYemen, Rep.ZambiaZimbabwe Timeline:
This timeline shows a graph from 1977 to 2005 of Papua New Guinea. No data until 1976. Number of actual observations by date: 29.
Source name:
World Development Indicators
Source organization:
World Bank staff estimates based on sources and methods in World Bank's "The Changing Wealth of Nations: Measuring Sustainable Development in the New Millennium" (2011).
Categories, topics:
Economy & Growth, Environment
Last updated:
apr 23, 2017
Indicators value changes by year
Minimum:
-5.614
jan 1, 2003
Maximum:
20.641
jan 1, 1978
At the date of observation
Value
Absolute change
Change from previous value
jan 1, 1977
12.048
+12.048
0.0%
jan 1, 1978
20.641
+8.593
71.32%
jan 1, 1979
17.817
-2.824
-13.68%
jan 1, 1980
17.68
-0.137
-0.77%
jan 1, 1981
3.878
-13.803
-78.07%
jan 1, 1982
-3.944
-7.822
-201.73%
jan 1, 1983
-1.93
+2.014
-51.06%
jan 1, 1984
0.945
+2.876
-148.97%
jan 1, 1985
7.698
+6.753
714.36%
jan 1, 1986
-2.307
-10.006
-129.97%
jan 1, 1987
1.654
+3.961
-171.69%
jan 1, 1988
-2.17
-3.824
-231.22%
jan 1, 1989
2.101
+4.271
-196.8%
jan 1, 1990
-4.512
-6.613
-314.77%
jan 1, 1991
0.815
+5.327
-118.06%
jan 1, 1992
4.474
+3.659
448.93%
jan 1, 1993
0.677
-3.798
-84.88%
jan 1, 1994
2.124
+1.448
213.93%
jan 1, 1995
6.812
+4.688
220.68%
jan 1, 1996
9.398
+2.586
37.96%
jan 1, 1997
4.447
-4.951
-52.68%
jan 1, 1998
-0.23
-4.677
-105.16%
jan 1, 1999
4.943
+5.173
-2.25K%
jan 1, 2000
-0.219
-5.163
-104.44%
jan 1, 2001
10.475
+10.694
-4.88K%
jan 1, 2002
7.176
-3.299
-31.5%
jan 1, 2003
-5.614
-12.79
-178.24%
jan 1, 2004
9.935
+15.549
-276.95%
jan 1, 2005
4.872
-5.062
-50.96%
Ranking of countries by current statistics by years


Comments: