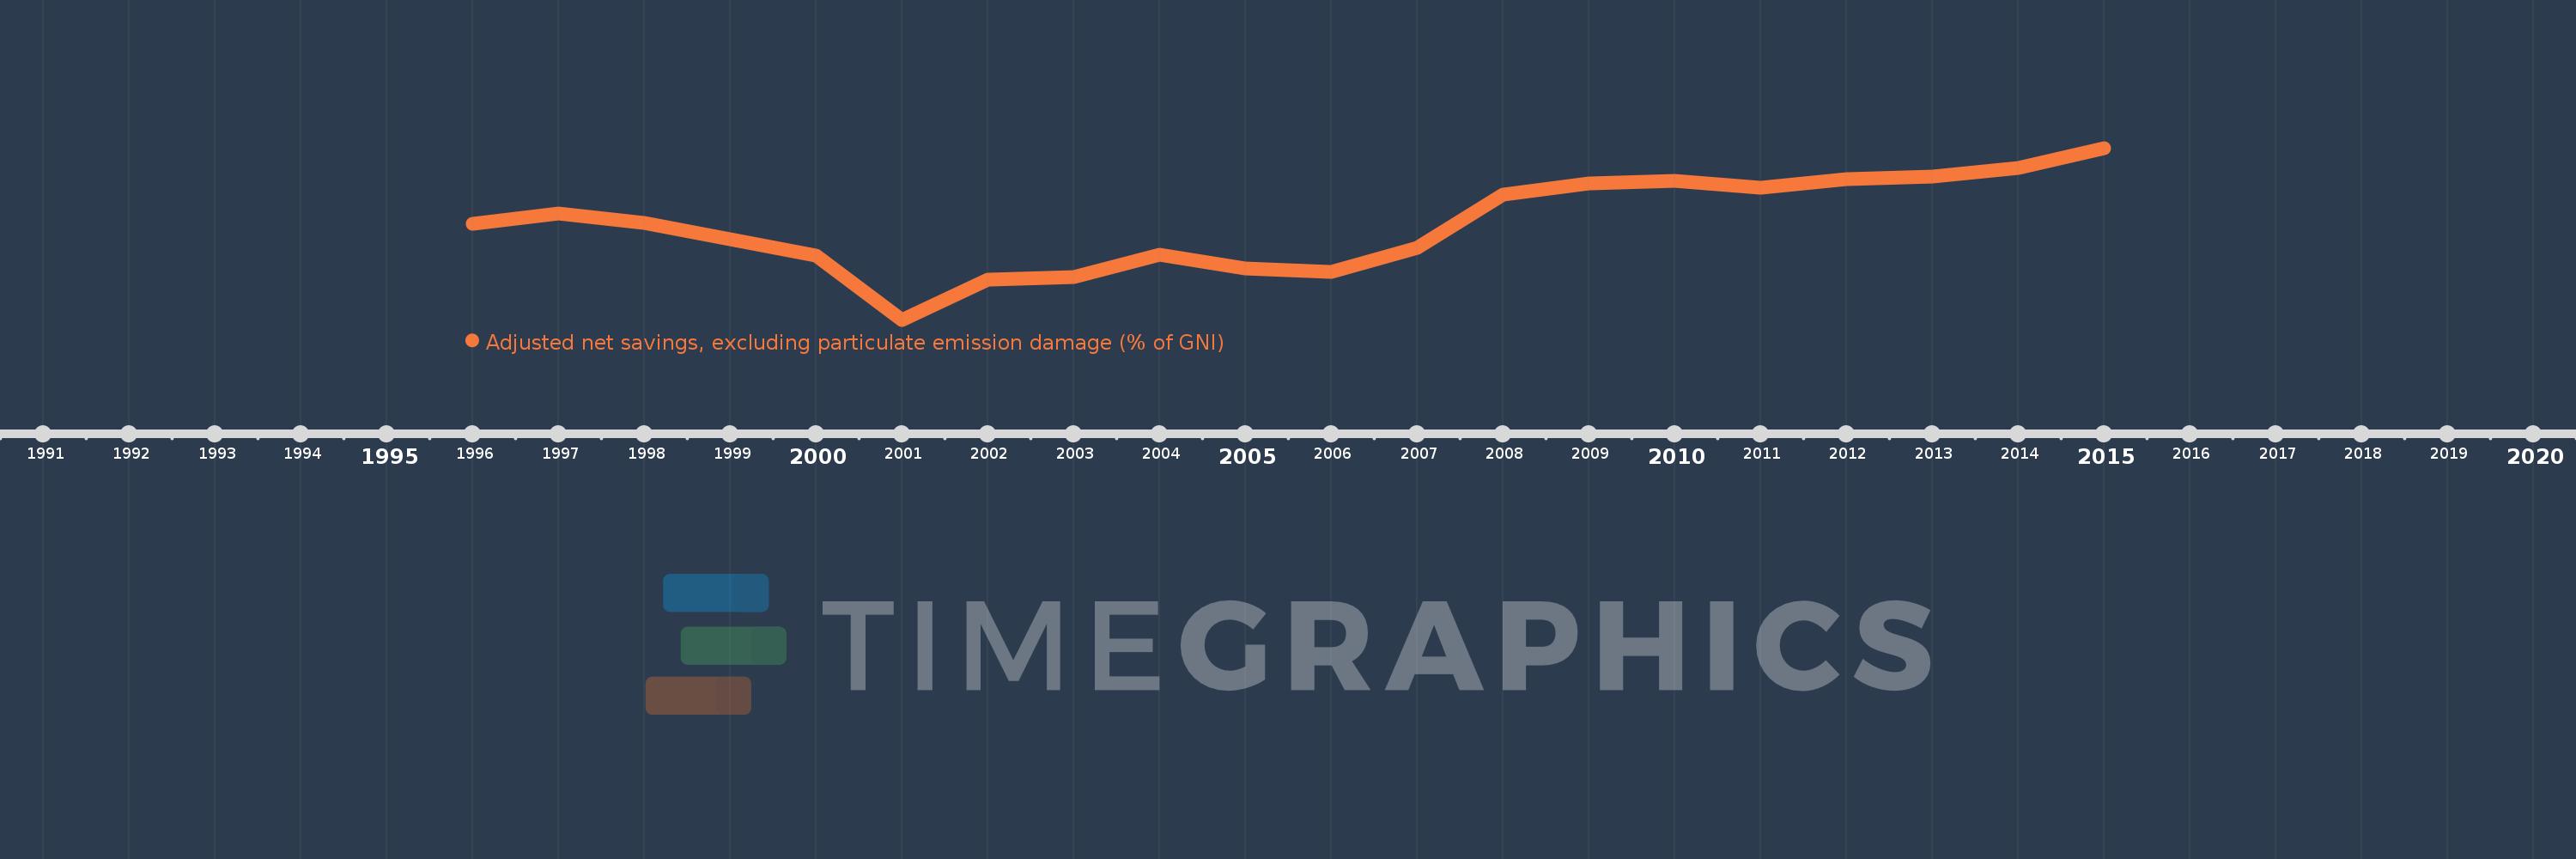
This timeline shows a graph from 1996 to 2015 of Kazakhstan. No data until 1995. Number of actual observations by date: 19.
Source name:
World Development Indicators
Source organization:
World Bank staff estimates based on sources and methods in World Bank's "The Changing Wealth of Nations: Measuring Sustainable Development in the New Millennium" (2011).
Categories, topics:
Economy & Growth, Environment
Last updated:
apr 23, 2017
Indicators value changes by year
Meaning:
-10.571
Minimum:
-28.229
jan 1, 2001
Maximum:
3.424
jan 1, 2015
At the date of observation
Value
Absolute change
Change from the previous value
jan 1, 1996
-10.569
-10.569
0.0%
jan 1, 1997
-8.654
+1.915
-18.12%
jan 1, 1998
-10.386
-1.732
20.01%
jan 1, 2000
-16.427
-6.041
58.17%
jan 1, 2001
-28.229
-11.802
71.85%
jan 1, 2002
-20.913
+7.316
-25.92%
jan 1, 2003
-20.362
+0.551
-2.63%
jan 1, 2004
-16.259
+4.104
-20.15%
jan 1, 2005
-18.742
-2.483
15.27%
jan 1, 2006
-19.432
-0.69
3.68%
jan 1, 2007
-15.061
+4.37
-22.49%
jan 1, 2008
-5.201
+9.861
-65.47%
jan 1, 2009
-3.085
+2.116
-40.68%
jan 1, 2010
-2.596
+0.489
-15.84%
jan 1, 2011
-3.943
-1.347
51.86%
jan 1, 2012
-2.334
+1.609
-40.81%
jan 1, 2013
-1.858
+0.476
-20.38%
jan 1, 2014
-0.217
+1.642
-88.35%
jan 1, 2015
3.424
+3.641
-1.68K%
Ranking of countries by current statistics by years
