29
/
en
AIzaSyAYiBZKx7MnpbEhh9jyipgxe19OcubqV5w
April 1, 2024
50607
Middle income
MIC
false
2
1
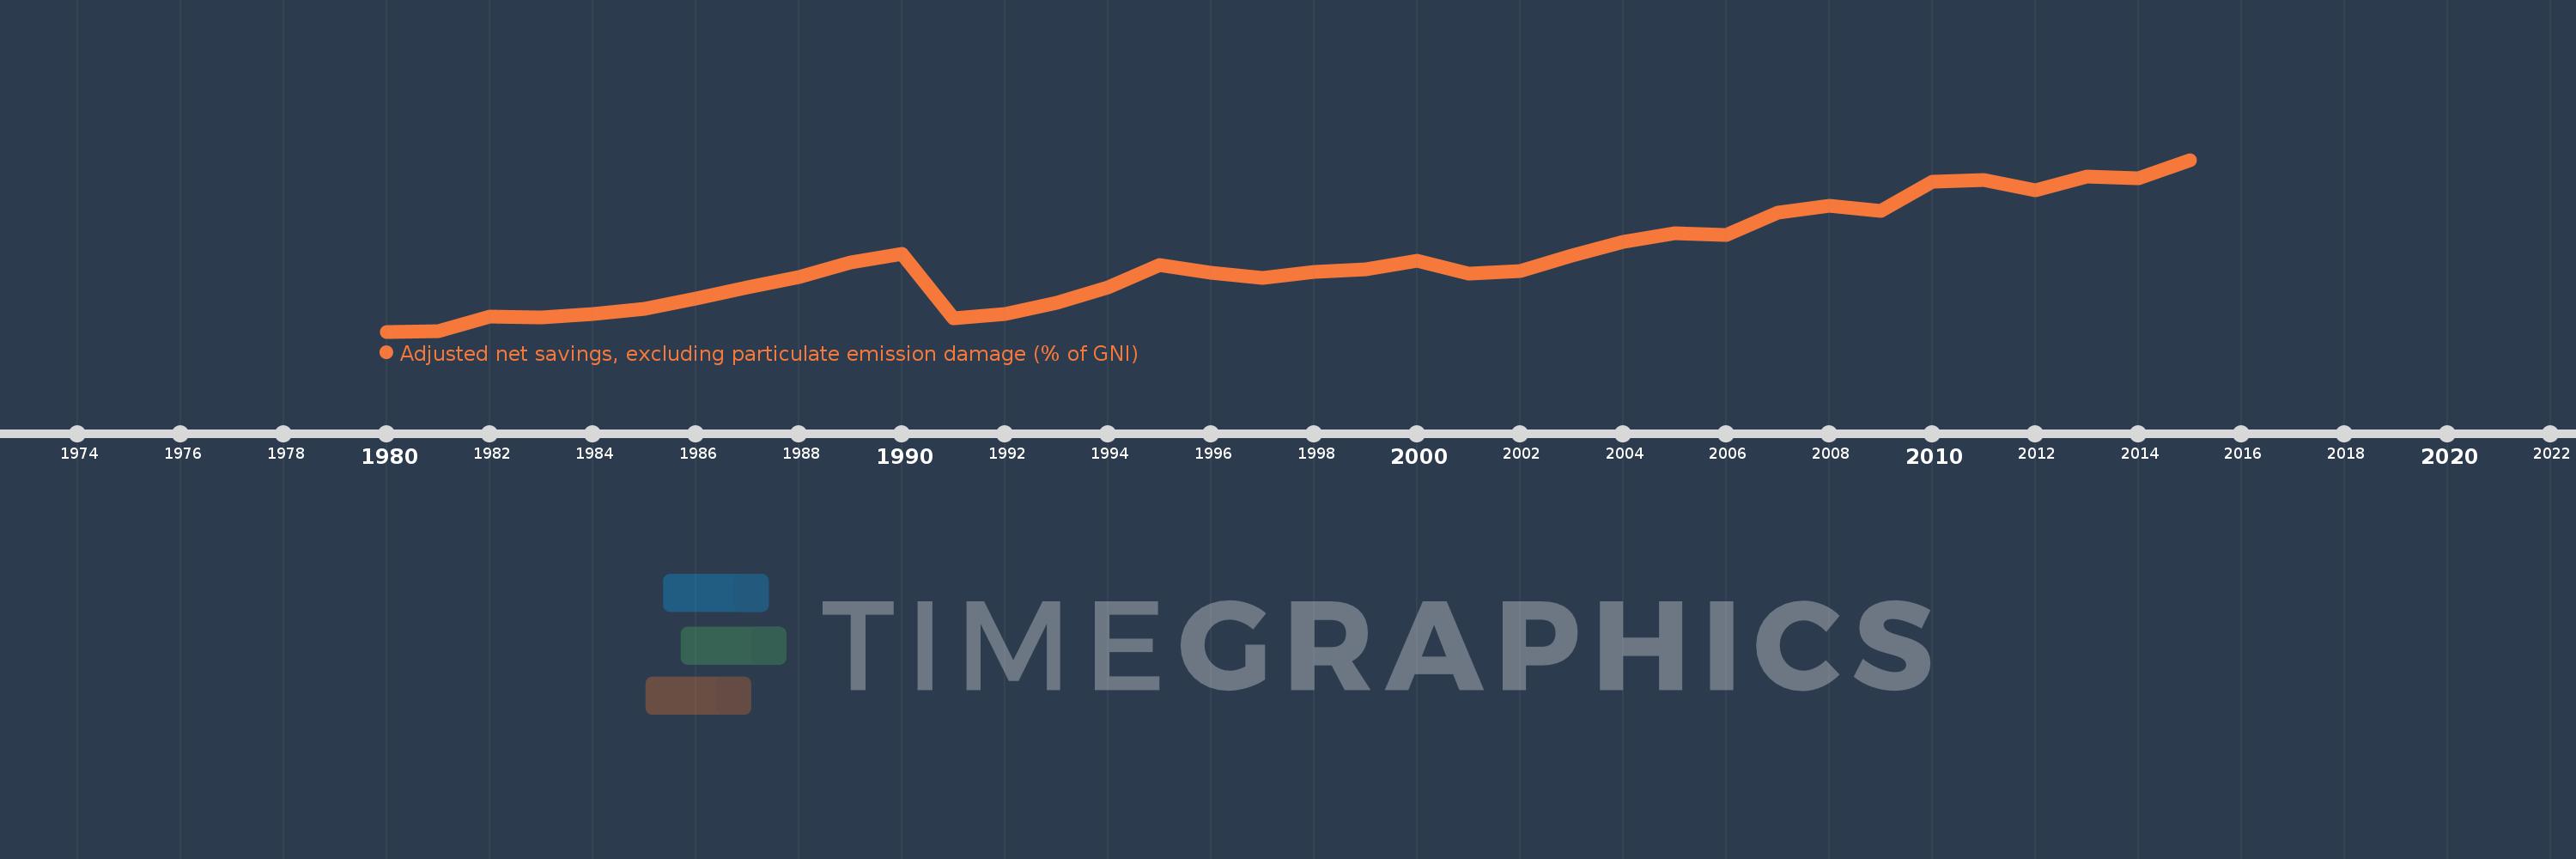
Adjusted net savings, excluding particulate emission damage (% of GNI)
2015,2014,2013,2012,2011,2010,2009,2008,2007,2006,2005,2004,2003,2002,2001,2000,1999,1998,1997,1996,1995,1994,1993,1992,1991,1990,1989,1988,1987,1986,1985,1984,1983,1982,1981,1980
This statistics in other country:
AfghanistanAlbaniaAlgeriaAngolaArab WorldArgentinaArmeniaAustraliaAustriaAzerbaijanBahamas, TheBahrainBangladeshBarbadosBelarusBelgiumBelizeBeninBhutanBoliviaBotswanaBrazilBrunei DarussalamBulgariaBurkina FasoBurundiCabo VerdeCambodiaCameroonCanadaCaribbean small statesCentral African RepublicCentral Europe and the BalticsChadChileChinaColombiaComorosCongo, Dem. Rep.Congo, Rep.Costa RicaCote d'IvoireCroatiaCyprusCzech RepublicDenmarkDjiboutiDominicaDominican RepublicEarly-demographic dividendEast Asia & PacificEast Asia & Pacific (excluding high income)East Asia & Pacific (IDA & IBRD countries)EcuadorEgypt, Arab Rep.El SalvadorEquatorial GuineaEritreaEstoniaEthiopiaEuro areaEurope & Central AsiaEurope & Central Asia (excluding high income)Europe & Central Asia (IDA & IBRD countries)European UnionFijiFinlandFragile and conflict affected situationsFranceGabonGambia, TheGeorgiaGermanyGhanaGreeceGuatemalaGuineaGuinea-BissauGuyanaHaitiHeavily indebted poor countries (HIPC)High incomeHondurasHungaryIBRD onlyIcelandIDA & IBRD totalIDA blendIDA onlyIDA totalIndiaIndonesiaIran, Islamic Rep.IraqIrelandIsraelItalyJamaicaJapanJordanKazakhstanKenyaKiribatiKorea, Rep.KuwaitKyrgyz RepublicLao PDRLate-demographic dividendLatin America & Caribbean Latin America & Caribbean (excluding high income)Latin America & the Caribbean (IDA & IBRD countries)LatviaLeast developed countries: UN classificationLebanonLesothoLiberiaLibyaLithuaniaLow & middle incomeLow incomeLower middle incomeLuxembourgMacedonia, FYRMadagascarMalawiMalaysiaMaldivesMaliMauritaniaMauritiusMexicoMiddle East & North AfricaMiddle East & North Africa (excluding high income)Middle East & North Africa (IDA & IBRD countries)Middle incomeMoldovaMongoliaMoroccoMozambiqueNamibiaNepalNetherlandsNew ZealandNicaraguaNigerNigeriaNorth AmericaNorwayOECD membersOmanOther small statesPacific island small statesPakistanPanamaPapua New GuineaParaguayPeruPhilippinesPolandPortugalPost-demographic dividendPre-demographic dividendQatarRomaniaRussian FederationRwandaSaudi ArabiaSenegalSeychellesSierra LeoneSingaporeSlovak RepublicSloveniaSmall statesSolomon IslandsSouth AfricaSouth AsiaSouth Asia (IDA & IBRD)SpainSri LankaSt. LuciaSt. Vincent and the GrenadinesSub-Saharan Africa Sub-Saharan Africa (excluding high income)Sub-Saharan Africa (IDA & IBRD countries)SudanSurinameSwazilandSwedenSwitzerlandSyrian Arab RepublicTajikistanTanzaniaThailandTogoTongaTrinidad and TobagoTunisiaTurkeyUgandaUkraineUnited KingdomUnited StatesUpper middle incomeUruguayVanuatuVenezuela, RBVietnamWorldYemen, Rep.ZambiaZimbabwe Timeline:
This timeline shows a graph from 1980 to 2015 of Middle income. No data until 1979. Number of actual observations by date: 36.
Source name:
World Development Indicators
Source organization:
World Bank staff estimates based on sources and methods in World Bank's "The Changing Wealth of Nations: Measuring Sustainable Development in the New Millennium" (2011).
Categories, topics:
Economy & Growth, Environment
Last updated:
apr 23, 2017
Indicators value changes by year
Maximum:
21.653
jan 1, 2015
At the date of observation
Value
Absolute change
Change from previous value
jan 1, 1980
6.912
+6.912
0.0%
jan 1, 1981
6.942
+0.03
0.44%
jan 1, 1982
8.208
+1.266
18.23%
jan 1, 1983
8.144
-0.064
-0.78%
jan 1, 1984
8.42
+0.276
3.39%
jan 1, 1985
8.873
+0.453
5.38%
jan 1, 1986
9.722
+0.848
9.56%
jan 1, 1987
10.698
+0.977
10.05%
jan 1, 1988
11.571
+0.873
8.16%
jan 1, 1989
12.821
+1.25
10.8%
jan 1, 1990
13.579
+0.758
5.91%
jan 1, 1991
8.044
-5.535
-40.76%
jan 1, 1992
8.452
+0.408
5.07%
jan 1, 1993
9.4
+0.948
11.22%
jan 1, 1994
10.683
+1.283
13.65%
jan 1, 1995
12.637
+1.955
18.3%
jan 1, 1996
11.97
-0.668
-5.28%
jan 1, 1997
11.512
-0.458
-3.82%
jan 1, 1998
12.041
+0.529
4.59%
jan 1, 1999
12.234
+0.193
1.61%
jan 1, 2000
12.996
+0.761
6.22%
jan 1, 2001
11.893
-1.103
-8.49%
jan 1, 2002
12.092
+0.199
1.68%
jan 1, 2003
13.417
+1.324
10.95%
jan 1, 2004
14.611
+1.194
8.9%
jan 1, 2005
15.342
+0.731
5.0%
jan 1, 2006
15.173
-0.169
-1.1%
jan 1, 2007
17.096
+1.923
12.68%
jan 1, 2008
17.709
+0.613
3.59%
jan 1, 2009
17.277
-0.432
-2.44%
jan 1, 2010
19.756
+2.479
14.35%
jan 1, 2011
19.907
+0.151
0.76%
jan 1, 2012
19.023
-0.884
-4.44%
jan 1, 2013
20.211
+1.189
6.25%
jan 1, 2014
20.062
-0.149
-0.74%
jan 1, 2015
21.653
+1.59
7.93%
Ranking of countries by current statistics by years


Comments: