29
/
en
AIzaSyAYiBZKx7MnpbEhh9jyipgxe19OcubqV5w
April 1, 2024
25458
Central Europe and the Baltics
CEB
false
2
1
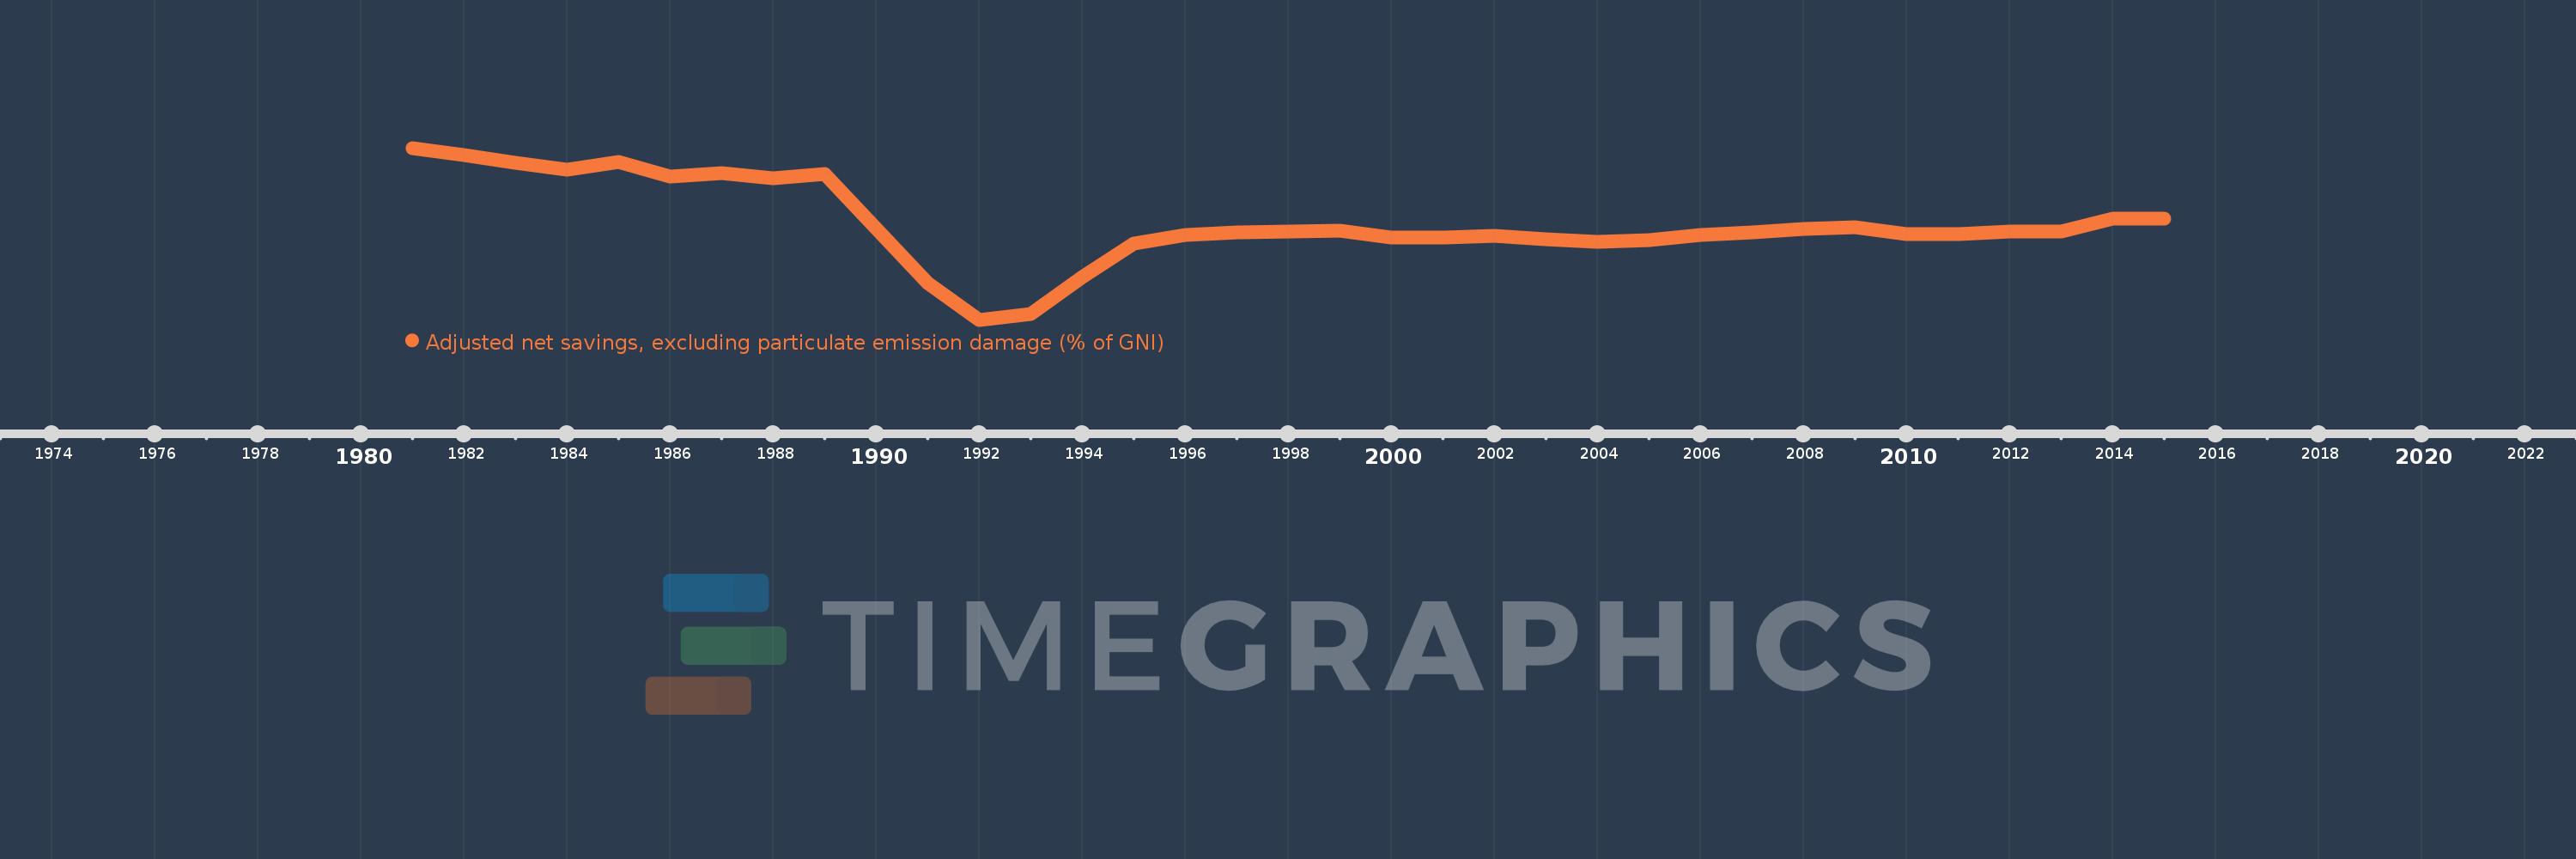
Adjusted net savings, excluding particulate emission damage (% of GNI)
2015,2014,2013,2012,2011,2010,2009,2008,2007,2006,2005,2004,2003,2002,2001,2000,1999,1998,1997,1996,1995,1994,1993,1992,1991,1989,1988,1987,1986,1985,1984,1983,1982,1981
This statistics in other country:
AfghanistanAlbaniaAlgeriaAngolaArab WorldArgentinaArmeniaAustraliaAustriaAzerbaijanBahamas, TheBahrainBangladeshBarbadosBelarusBelgiumBelizeBeninBhutanBoliviaBotswanaBrazilBrunei DarussalamBulgariaBurkina FasoBurundiCabo VerdeCambodiaCameroonCanadaCaribbean small statesCentral African RepublicCentral Europe and the BalticsChadChileChinaColombiaComorosCongo, Dem. Rep.Congo, Rep.Costa RicaCote d'IvoireCroatiaCyprusCzech RepublicDenmarkDjiboutiDominicaDominican RepublicEarly-demographic dividendEast Asia & PacificEast Asia & Pacific (excluding high income)East Asia & Pacific (IDA & IBRD countries)EcuadorEgypt, Arab Rep.El SalvadorEquatorial GuineaEritreaEstoniaEthiopiaEuro areaEurope & Central AsiaEurope & Central Asia (excluding high income)Europe & Central Asia (IDA & IBRD countries)European UnionFijiFinlandFragile and conflict affected situationsFranceGabonGambia, TheGeorgiaGermanyGhanaGreeceGuatemalaGuineaGuinea-BissauGuyanaHaitiHeavily indebted poor countries (HIPC)High incomeHondurasHungaryIBRD onlyIcelandIDA & IBRD totalIDA blendIDA onlyIDA totalIndiaIndonesiaIran, Islamic Rep.IraqIrelandIsraelItalyJamaicaJapanJordanKazakhstanKenyaKiribatiKorea, Rep.KuwaitKyrgyz RepublicLao PDRLate-demographic dividendLatin America & Caribbean Latin America & Caribbean (excluding high income)Latin America & the Caribbean (IDA & IBRD countries)LatviaLeast developed countries: UN classificationLebanonLesothoLiberiaLibyaLithuaniaLow & middle incomeLow incomeLower middle incomeLuxembourgMacedonia, FYRMadagascarMalawiMalaysiaMaldivesMaliMauritaniaMauritiusMexicoMiddle East & North AfricaMiddle East & North Africa (excluding high income)Middle East & North Africa (IDA & IBRD countries)Middle incomeMoldovaMongoliaMoroccoMozambiqueNamibiaNepalNetherlandsNew ZealandNicaraguaNigerNigeriaNorth AmericaNorwayOECD membersOmanOther small statesPacific island small statesPakistanPanamaPapua New GuineaParaguayPeruPhilippinesPolandPortugalPost-demographic dividendPre-demographic dividendQatarRomaniaRussian FederationRwandaSaudi ArabiaSenegalSeychellesSierra LeoneSingaporeSlovak RepublicSloveniaSmall statesSolomon IslandsSouth AfricaSouth AsiaSouth Asia (IDA & IBRD)SpainSri LankaSt. LuciaSt. Vincent and the GrenadinesSub-Saharan Africa Sub-Saharan Africa (excluding high income)Sub-Saharan Africa (IDA & IBRD countries)SudanSurinameSwazilandSwedenSwitzerlandSyrian Arab RepublicTajikistanTanzaniaThailandTogoTongaTrinidad and TobagoTunisiaTurkeyUgandaUkraineUnited KingdomUnited StatesUpper middle incomeUruguayVanuatuVenezuela, RBVietnamWorldYemen, Rep.ZambiaZimbabwe Timeline:
This timeline shows a graph from 1981 to 2015 of Central Europe and the Baltics. No data until 1980. Number of actual observations by date: 34.
Source name:
World Development Indicators
Source organization:
World Bank staff estimates based on sources and methods in World Bank's "The Changing Wealth of Nations: Measuring Sustainable Development in the New Millennium" (2011).
Categories, topics:
Economy & Growth, Environment
Last updated:
apr 23, 2017
Indicators value changes by year
Minimum:
-15.007
jan 1, 1992
Maximum:
29.017
jan 1, 1981
At the date of observation
Value
Absolute change
Change from previous value
jan 1, 1981
29.017
+29.017
0.0%
jan 1, 1982
27.236
-1.781
-6.14%
jan 1, 1983
25.31
-1.926
-7.07%
jan 1, 1984
23.392
-1.918
-7.58%
jan 1, 1985
25.456
+2.065
8.83%
jan 1, 1986
21.657
-3.799
-14.92%
jan 1, 1987
22.588
+0.931
4.3%
jan 1, 1988
21.193
-1.395
-6.18%
jan 1, 1989
22.45
+1.257
5.93%
jan 1, 1991
-5.532
-27.982
-124.64%
jan 1, 1992
-15.007
-9.475
171.29%
jan 1, 1993
-13.49
+1.517
-10.11%
jan 1, 1994
-4.114
+9.375
-69.5%
jan 1, 1995
4.416
+8.53
-207.33%
jan 1, 1996
6.707
+2.291
51.88%
jan 1, 1997
7.35
+0.643
9.59%
jan 1, 1998
7.555
+0.205
2.79%
jan 1, 1999
7.747
+0.192
2.54%
jan 1, 2000
5.953
-1.794
-23.16%
jan 1, 2001
6.02
+0.067
1.12%
jan 1, 2002
6.419
+0.399
6.64%
jan 1, 2003
5.687
-0.732
-11.41%
jan 1, 2004
4.923
-0.764
-13.44%
jan 1, 2005
5.424
+0.501
10.18%
jan 1, 2006
6.638
+1.214
22.38%
jan 1, 2007
7.279
+0.641
9.66%
jan 1, 2008
8.324
+1.045
14.35%
jan 1, 2009
8.687
+0.364
4.37%
jan 1, 2010
6.954
-1.734
-19.95%
jan 1, 2011
6.863
-0.091
-1.31%
jan 1, 2012
7.699
+0.837
12.19%
jan 1, 2013
7.675
-0.024
-0.31%
jan 1, 2014
10.81
+3.135
40.84%
jan 1, 2015
10.837
+0.027
0.25%
Ranking of countries by current statistics by years


Comments: