29
/
en
AIzaSyAYiBZKx7MnpbEhh9jyipgxe19OcubqV5w
April 1, 2024
100793
Canada
CAN
true
2
1
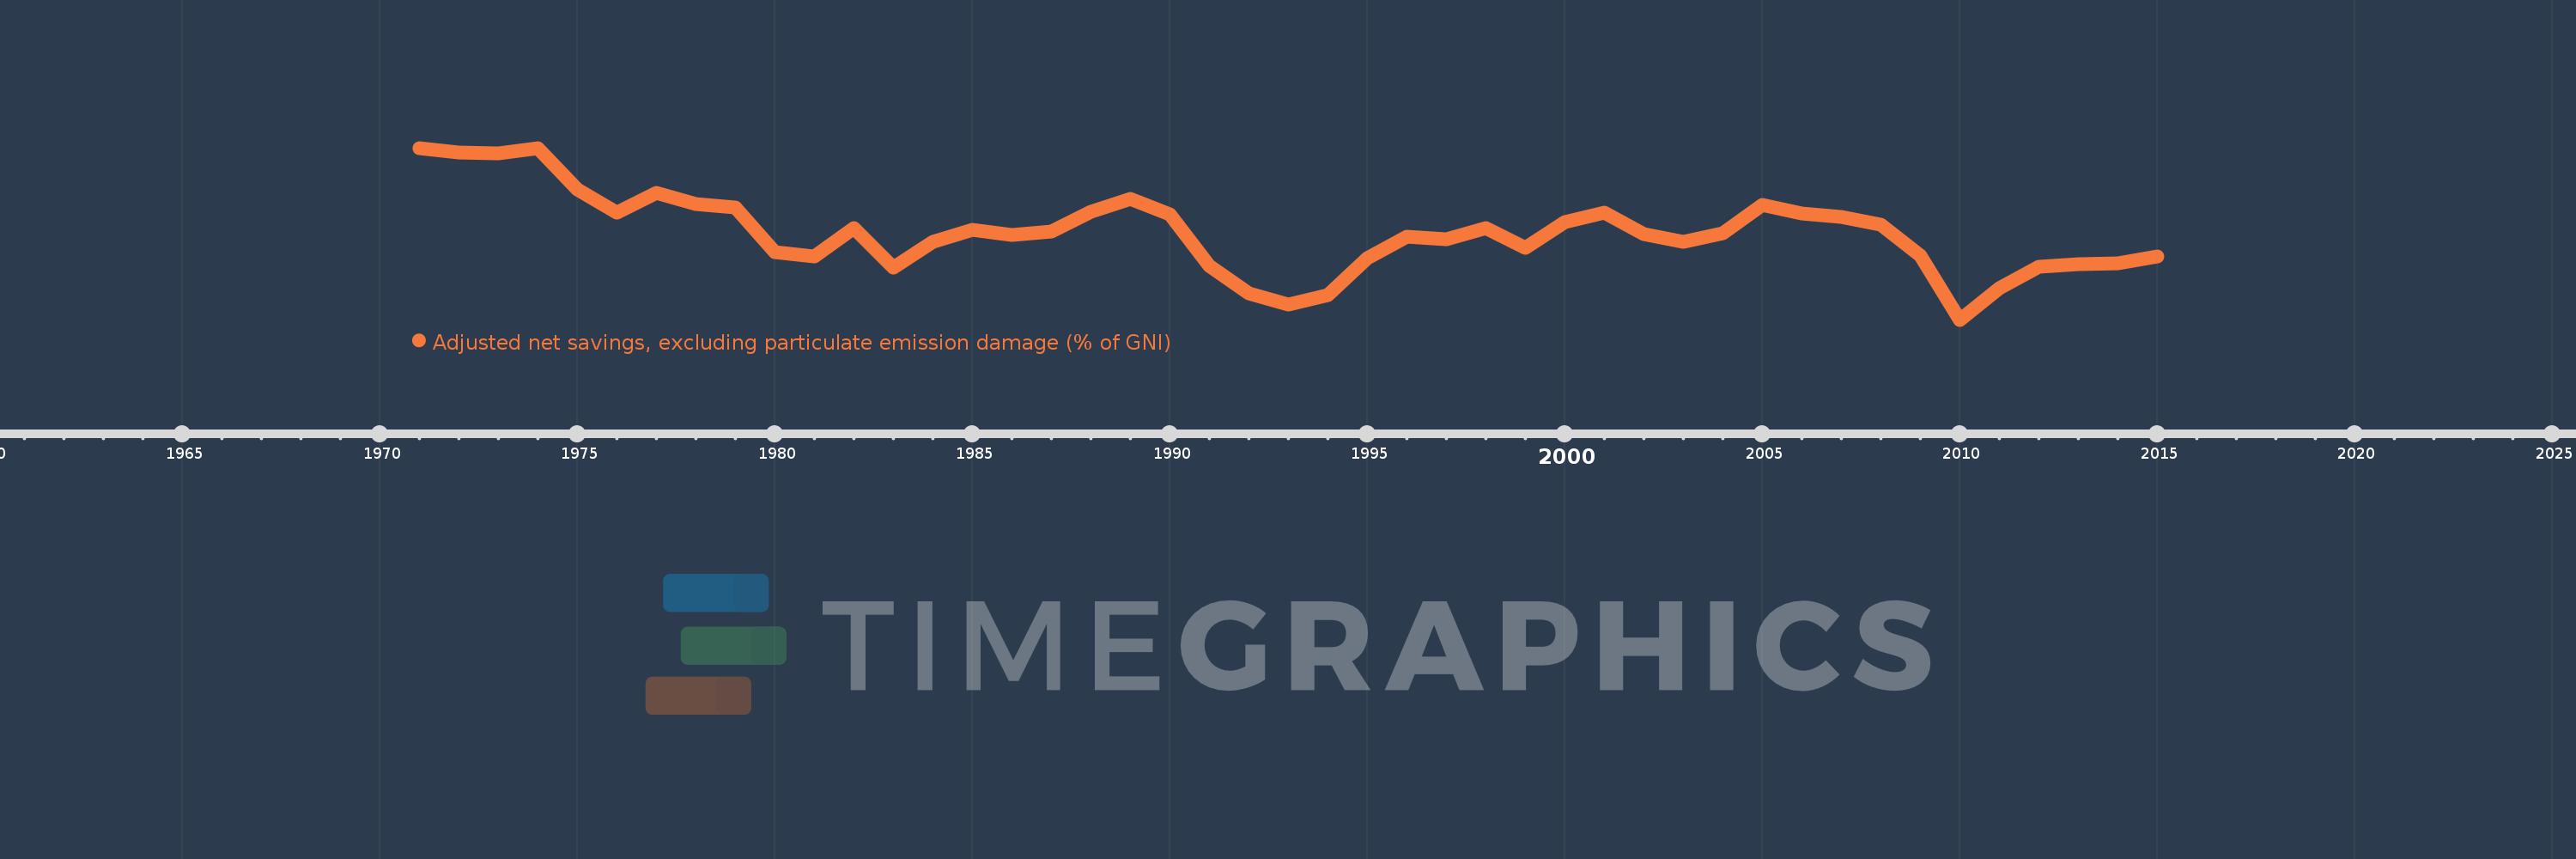
Adjusted net savings, excluding particulate emission damage (% of GNI)
2015,2014,2013,2012,2011,2010,2009,2008,2007,2006,2005,2004,2003,2002,2001,2000,1999,1998,1997,1996,1995,1994,1993,1992,1991,1990,1989,1988,1987,1986,1985,1984,1983,1982,1981,1980,1979,1978,1977,1976,1975,1974,1973,1972,1971
This statistics in other country:
AfghanistanAlbaniaAlgeriaAngolaArab WorldArgentinaArmeniaAustraliaAustriaAzerbaijanBahamas, TheBahrainBangladeshBarbadosBelarusBelgiumBelizeBeninBhutanBoliviaBotswanaBrazilBrunei DarussalamBulgariaBurkina FasoBurundiCabo VerdeCambodiaCameroonCanadaCaribbean small statesCentral African RepublicCentral Europe and the BalticsChadChileChinaColombiaComorosCongo, Dem. Rep.Congo, Rep.Costa RicaCote d'IvoireCroatiaCyprusCzech RepublicDenmarkDjiboutiDominicaDominican RepublicEarly-demographic dividendEast Asia & PacificEast Asia & Pacific (excluding high income)East Asia & Pacific (IDA & IBRD countries)EcuadorEgypt, Arab Rep.El SalvadorEquatorial GuineaEritreaEstoniaEthiopiaEuro areaEurope & Central AsiaEurope & Central Asia (excluding high income)Europe & Central Asia (IDA & IBRD countries)European UnionFijiFinlandFragile and conflict affected situationsFranceGabonGambia, TheGeorgiaGermanyGhanaGreeceGuatemalaGuineaGuinea-BissauGuyanaHaitiHeavily indebted poor countries (HIPC)High incomeHondurasHungaryIBRD onlyIcelandIDA & IBRD totalIDA blendIDA onlyIDA totalIndiaIndonesiaIran, Islamic Rep.IraqIrelandIsraelItalyJamaicaJapanJordanKazakhstanKenyaKiribatiKorea, Rep.KuwaitKyrgyz RepublicLao PDRLate-demographic dividendLatin America & Caribbean Latin America & Caribbean (excluding high income)Latin America & the Caribbean (IDA & IBRD countries)LatviaLeast developed countries: UN classificationLebanonLesothoLiberiaLibyaLithuaniaLow & middle incomeLow incomeLower middle incomeLuxembourgMacedonia, FYRMadagascarMalawiMalaysiaMaldivesMaliMauritaniaMauritiusMexicoMiddle East & North AfricaMiddle East & North Africa (excluding high income)Middle East & North Africa (IDA & IBRD countries)Middle incomeMoldovaMongoliaMoroccoMozambiqueNamibiaNepalNetherlandsNew ZealandNicaraguaNigerNigeriaNorth AmericaNorwayOECD membersOmanOther small statesPacific island small statesPakistanPanamaPapua New GuineaParaguayPeruPhilippinesPolandPortugalPost-demographic dividendPre-demographic dividendQatarRomaniaRussian FederationRwandaSaudi ArabiaSenegalSeychellesSierra LeoneSingaporeSlovak RepublicSloveniaSmall statesSolomon IslandsSouth AfricaSouth AsiaSouth Asia (IDA & IBRD)SpainSri LankaSt. LuciaSt. Vincent and the GrenadinesSub-Saharan Africa Sub-Saharan Africa (excluding high income)Sub-Saharan Africa (IDA & IBRD countries)SudanSurinameSwazilandSwedenSwitzerlandSyrian Arab RepublicTajikistanTanzaniaThailandTogoTongaTrinidad and TobagoTunisiaTurkeyUgandaUkraineUnited KingdomUnited StatesUpper middle incomeUruguayVanuatuVenezuela, RBVietnamWorldYemen, Rep.ZambiaZimbabwe Timeline:
This timeline shows a graph from 1971 to 2015 of Canada. No data until 1970. Number of actual observations by date: 45.
Source name:
World Development Indicators
Source organization:
World Bank staff estimates based on sources and methods in World Bank's "The Changing Wealth of Nations: Measuring Sustainable Development in the New Millennium" (2011).
Categories, topics:
Economy & Growth, Environment
Last updated:
apr 23, 2017
Indicators value changes by year
Maximum:
14.332
jan 1, 1971
At the date of observation
Value
Absolute change
Change from previous value
jan 1, 1971
14.332
+14.332
0.0%
jan 1, 1972
14.025
-0.307
-2.14%
jan 1, 1973
13.964
-0.061
-0.44%
jan 1, 1974
14.302
+0.338
2.42%
jan 1, 1975
11.602
-2.7
-18.88%
jan 1, 1976
10.038
-1.565
-13.49%
jan 1, 1977
11.333
+1.296
12.91%
jan 1, 1978
10.59
-0.743
-6.56%
jan 1, 1979
10.353
-0.237
-2.24%
jan 1, 1980
7.394
-2.959
-28.58%
jan 1, 1981
7.144
-0.25
-3.38%
jan 1, 1982
9.035
+1.892
26.48%
jan 1, 1983
6.374
-2.661
-29.45%
jan 1, 1984
8.08
+1.705
26.75%
jan 1, 1985
8.887
+0.807
9.99%
jan 1, 1986
8.533
-0.354
-3.98%
jan 1, 1987
8.8
+0.267
3.13%
jan 1, 1988
10.072
+1.271
14.45%
jan 1, 1989
10.974
+0.903
8.96%
jan 1, 1990
9.933
-1.041
-9.49%
jan 1, 1991
6.517
-3.416
-34.39%
jan 1, 1992
4.689
-1.828
-28.05%
jan 1, 1993
3.955
-0.734
-15.65%
jan 1, 1994
4.551
+0.596
15.07%
jan 1, 1995
7.016
+2.465
54.17%
jan 1, 1996
8.413
+1.397
19.9%
jan 1, 1997
8.264
-0.149
-1.77%
jan 1, 1998
9.036
+0.772
9.34%
jan 1, 1999
7.724
-1.311
-14.51%
jan 1, 2000
9.413
+1.688
21.86%
jan 1, 2001
10.04
+0.628
6.67%
jan 1, 2002
8.602
-1.439
-14.33%
jan 1, 2003
8.103
-0.499
-5.8%
jan 1, 2004
8.653
+0.55
6.78%
jan 1, 2005
10.543
+1.89
21.84%
jan 1, 2006
9.981
-0.562
-5.33%
jan 1, 2007
9.724
-0.257
-2.58%
jan 1, 2008
9.241
-0.483
-4.97%
jan 1, 2009
7.199
-2.041
-22.09%
jan 1, 2010
2.921
-4.278
-59.43%
jan 1, 2011
5.024
+2.103
72.01%
jan 1, 2012
6.468
+1.444
28.75%
jan 1, 2013
6.605
+0.137
2.12%
jan 1, 2014
6.657
+0.051
0.78%
jan 1, 2015
7.104
+0.447
6.72%
Ranking of countries by current statistics by years


Comments: