29
/
en
AIzaSyAYiBZKx7MnpbEhh9jyipgxe19OcubqV5w
April 1, 2024
57830
South Asia (IDA & IBRD)
TSA
false
2
1
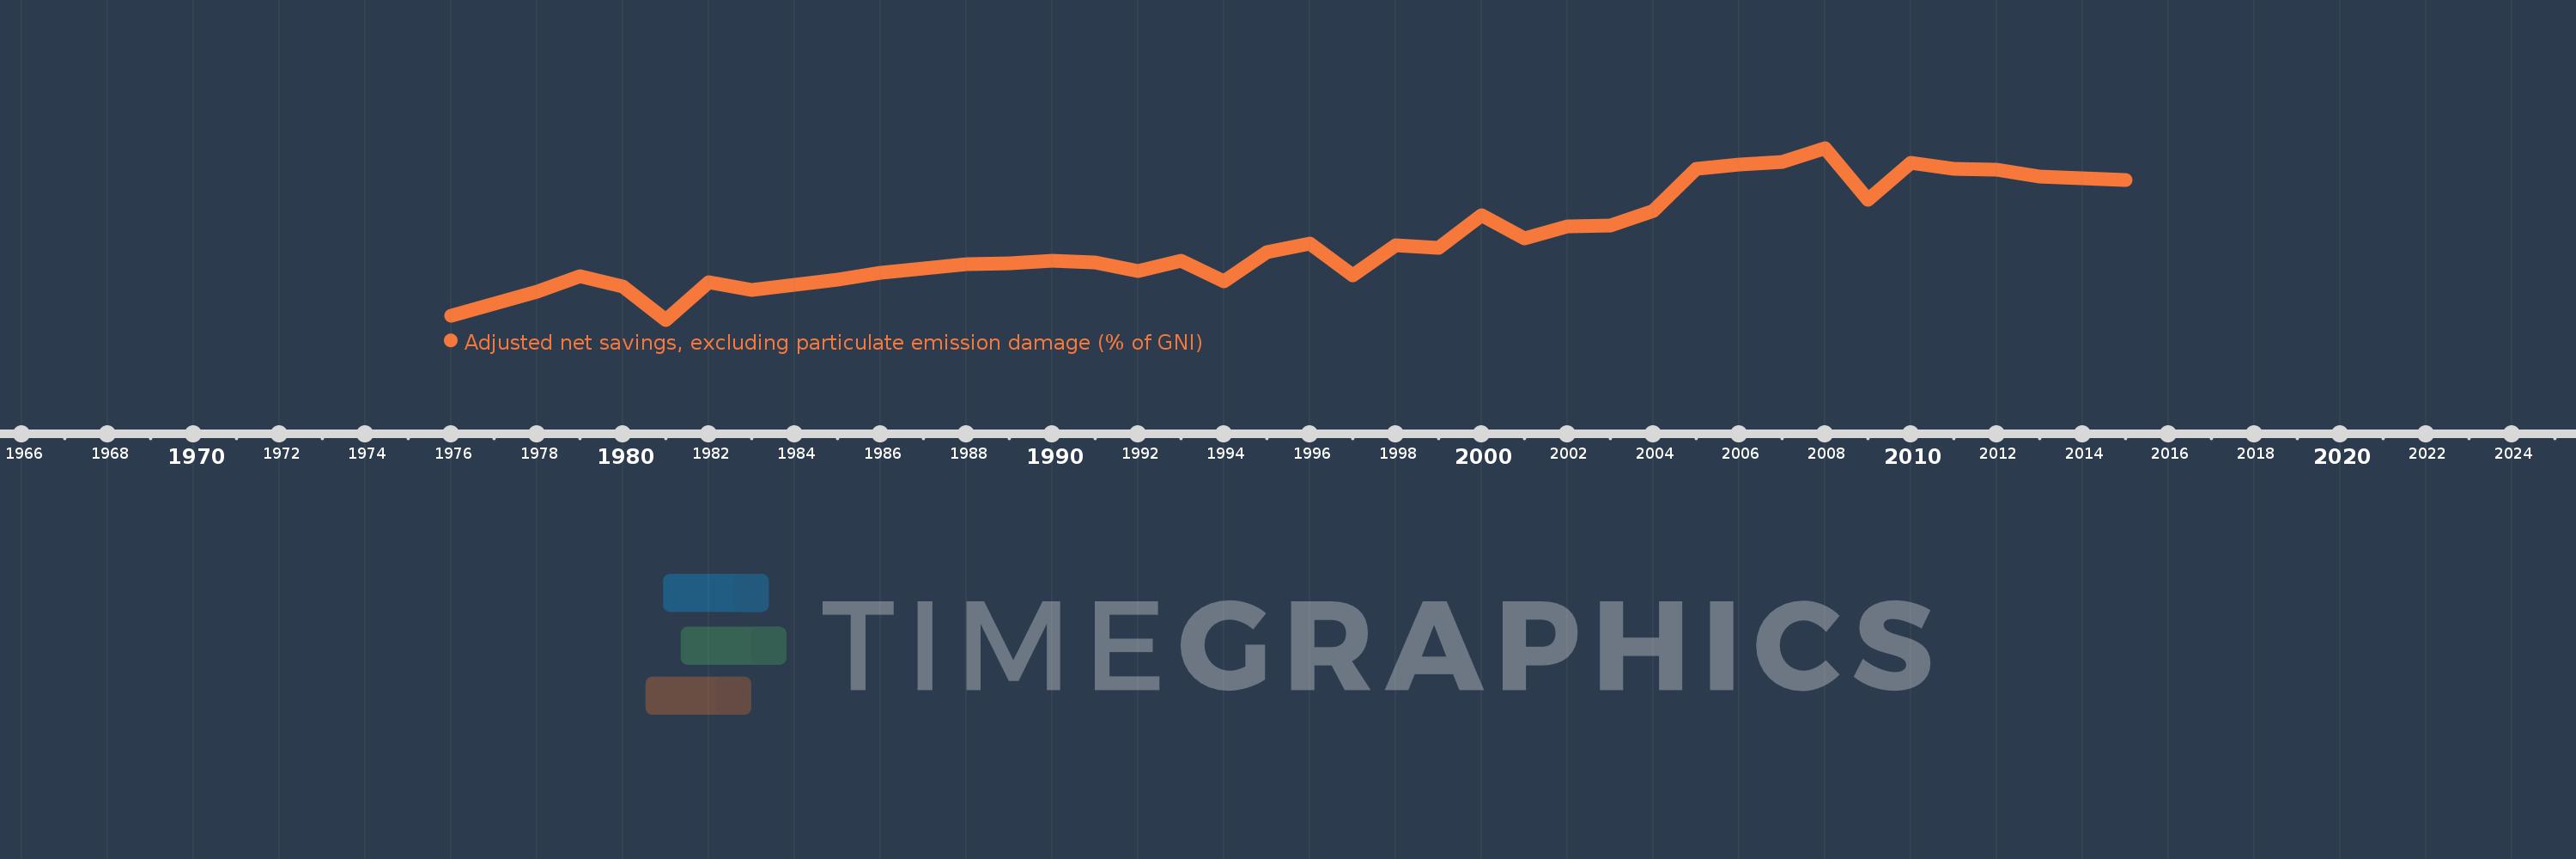
Adjusted net savings, excluding particulate emission damage (% of GNI)
2015,2014,2013,2012,2011,2010,2009,2008,2007,2006,2005,2004,2003,2002,2001,2000,1999,1998,1997,1996,1995,1994,1993,1992,1991,1990,1989,1988,1987,1986,1985,1984,1983,1982,1981,1980,1979,1978,1977,1976
This statistics in other country:
AfghanistanAlbaniaAlgeriaAngolaArab WorldArgentinaArmeniaAustraliaAustriaAzerbaijanBahamas, TheBahrainBangladeshBarbadosBelarusBelgiumBelizeBeninBhutanBoliviaBotswanaBrazilBrunei DarussalamBulgariaBurkina FasoBurundiCabo VerdeCambodiaCameroonCanadaCaribbean small statesCentral African RepublicCentral Europe and the BalticsChadChileChinaColombiaComorosCongo, Dem. Rep.Congo, Rep.Costa RicaCote d'IvoireCroatiaCyprusCzech RepublicDenmarkDjiboutiDominicaDominican RepublicEarly-demographic dividendEast Asia & PacificEast Asia & Pacific (excluding high income)East Asia & Pacific (IDA & IBRD countries)EcuadorEgypt, Arab Rep.El SalvadorEquatorial GuineaEritreaEstoniaEthiopiaEuro areaEurope & Central AsiaEurope & Central Asia (excluding high income)Europe & Central Asia (IDA & IBRD countries)European UnionFijiFinlandFragile and conflict affected situationsFranceGabonGambia, TheGeorgiaGermanyGhanaGreeceGuatemalaGuineaGuinea-BissauGuyanaHaitiHeavily indebted poor countries (HIPC)High incomeHondurasHungaryIBRD onlyIcelandIDA & IBRD totalIDA blendIDA onlyIDA totalIndiaIndonesiaIran, Islamic Rep.IraqIrelandIsraelItalyJamaicaJapanJordanKazakhstanKenyaKiribatiKorea, Rep.KuwaitKyrgyz RepublicLao PDRLate-demographic dividendLatin America & Caribbean Latin America & Caribbean (excluding high income)Latin America & the Caribbean (IDA & IBRD countries)LatviaLeast developed countries: UN classificationLebanonLesothoLiberiaLibyaLithuaniaLow & middle incomeLow incomeLower middle incomeLuxembourgMacedonia, FYRMadagascarMalawiMalaysiaMaldivesMaliMauritaniaMauritiusMexicoMiddle East & North AfricaMiddle East & North Africa (excluding high income)Middle East & North Africa (IDA & IBRD countries)Middle incomeMoldovaMongoliaMoroccoMozambiqueNamibiaNepalNetherlandsNew ZealandNicaraguaNigerNigeriaNorth AmericaNorwayOECD membersOmanOther small statesPacific island small statesPakistanPanamaPapua New GuineaParaguayPeruPhilippinesPolandPortugalPost-demographic dividendPre-demographic dividendQatarRomaniaRussian FederationRwandaSaudi ArabiaSenegalSeychellesSierra LeoneSingaporeSlovak RepublicSloveniaSmall statesSolomon IslandsSouth AfricaSouth AsiaSouth Asia (IDA & IBRD)SpainSri LankaSt. LuciaSt. Vincent and the GrenadinesSub-Saharan Africa Sub-Saharan Africa (excluding high income)Sub-Saharan Africa (IDA & IBRD countries)SudanSurinameSwazilandSwedenSwitzerlandSyrian Arab RepublicTajikistanTanzaniaThailandTogoTongaTrinidad and TobagoTunisiaTurkeyUgandaUkraineUnited KingdomUnited StatesUpper middle incomeUruguayVanuatuVenezuela, RBVietnamWorldYemen, Rep.ZambiaZimbabwe Timeline:
This timeline shows a graph from 1976 to 2015 of South Asia (IDA & IBRD). No data until 1975. Number of actual observations by date: 40.
Source name:
World Development Indicators
Source organization:
World Bank staff estimates based on sources and methods in World Bank's "The Changing Wealth of Nations: Measuring Sustainable Development in the New Millennium" (2011).
Categories, topics:
Economy & Growth, Environment
Last updated:
apr 23, 2017
Indicators value changes by year
Maximum:
22.948
jan 1, 2008
At the date of observation
Value
Absolute change
Change from previous value
jan 1, 1976
7.154
+7.154
0.0%
jan 1, 1977
8.31
+1.156
16.15%
jan 1, 1978
9.446
+1.136
13.67%
jan 1, 1979
10.893
+1.447
15.32%
jan 1, 1980
9.899
-0.994
-9.13%
jan 1, 1981
6.803
-3.096
-31.27%
jan 1, 1982
10.332
+3.529
51.87%
jan 1, 1983
9.573
-0.76
-7.35%
jan 1, 1984
10.071
+0.499
5.21%
jan 1, 1985
10.571
+0.5
4.96%
jan 1, 1986
11.254
+0.683
6.46%
jan 1, 1987
11.643
+0.389
3.46%
jan 1, 1988
12.0
+0.357
3.06%
jan 1, 1989
12.142
+0.142
1.18%
jan 1, 1990
12.364
+0.222
1.83%
jan 1, 1991
12.204
-0.16
-1.29%
jan 1, 1992
11.386
-0.818
-6.7%
jan 1, 1993
12.321
+0.934
8.21%
jan 1, 1994
10.43
-1.891
-15.35%
jan 1, 1995
13.169
+2.739
26.26%
jan 1, 1996
13.948
+0.78
5.92%
jan 1, 1997
10.964
-2.984
-21.39%
jan 1, 1998
13.833
+2.869
26.16%
jan 1, 1999
13.582
-0.25
-1.81%
jan 1, 2000
16.609
+3.027
22.29%
jan 1, 2001
14.467
-2.142
-12.9%
jan 1, 2002
15.569
+1.102
7.61%
jan 1, 2003
15.691
+0.123
0.79%
jan 1, 2004
17.065
+1.374
8.76%
jan 1, 2005
21.022
+3.957
23.19%
jan 1, 2006
21.371
+0.349
1.66%
jan 1, 2007
21.6
+0.228
1.07%
jan 1, 2008
22.948
+1.348
6.24%
jan 1, 2009
18.116
-4.832
-21.06%
jan 1, 2010
21.528
+3.413
18.84%
jan 1, 2011
21.016
-0.513
-2.38%
jan 1, 2012
20.926
-0.09
-0.43%
jan 1, 2013
20.267
-0.659
-3.15%
jan 1, 2014
20.092
-0.176
-0.87%
jan 1, 2015
19.908
-0.184
-0.92%
Ranking of countries by current statistics by years


Comments: