29
/
en
AIzaSyAYiBZKx7MnpbEhh9jyipgxe19OcubqV5w
April 1, 2024
120620
Dominica
DMA
true
2
1
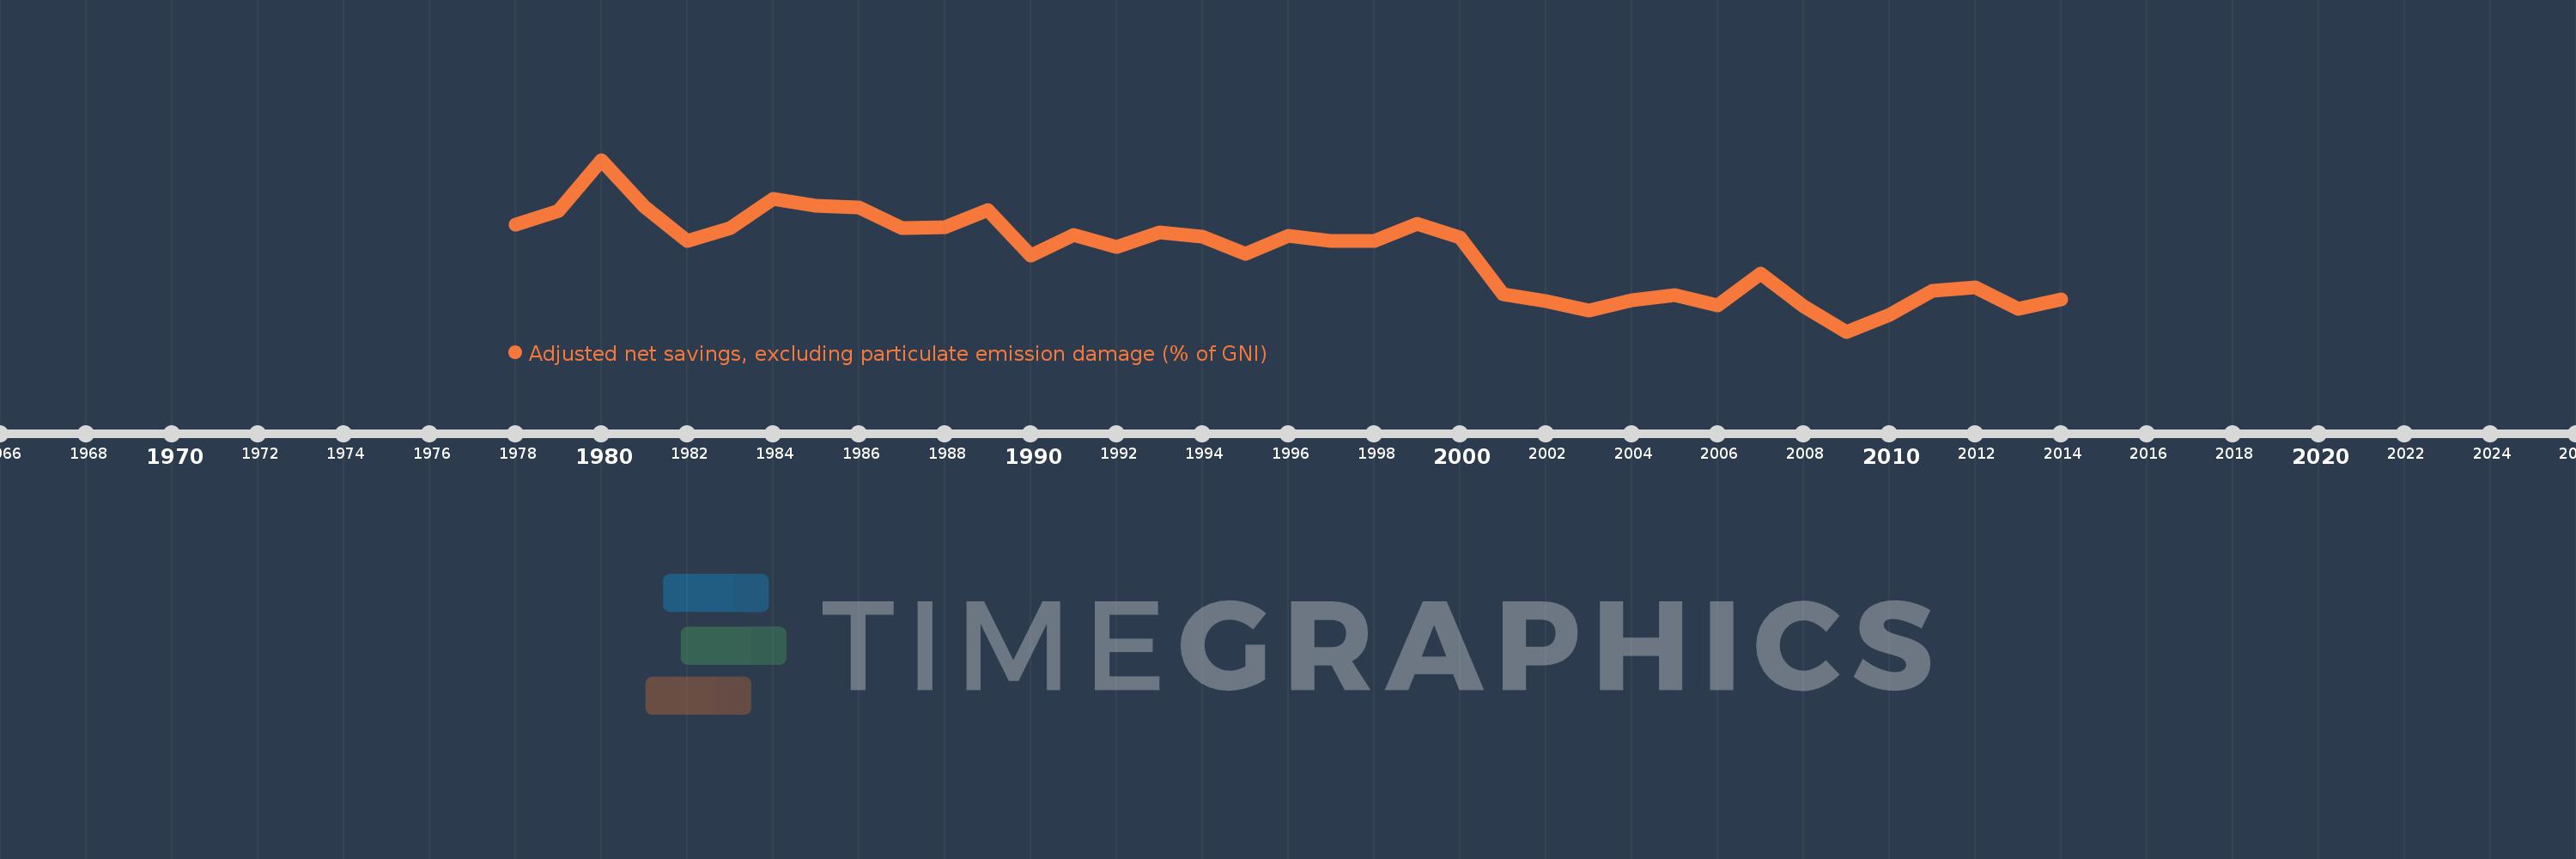
Adjusted net savings, excluding particulate emission damage (% of GNI)
2014,2013,2012,2011,2010,2009,2008,2007,2006,2005,2004,2003,2002,2001,2000,1999,1998,1997,1996,1995,1994,1993,1992,1991,1990,1989,1988,1987,1986,1985,1984,1983,1982,1981,1980,1979,1978
This statistics in other country:
AfghanistanAlbaniaAlgeriaAngolaArab WorldArgentinaArmeniaAustraliaAustriaAzerbaijanBahamas, TheBahrainBangladeshBarbadosBelarusBelgiumBelizeBeninBhutanBoliviaBotswanaBrazilBrunei DarussalamBulgariaBurkina FasoBurundiCabo VerdeCambodiaCameroonCanadaCaribbean small statesCentral African RepublicCentral Europe and the BalticsChadChileChinaColombiaComorosCongo, Dem. Rep.Congo, Rep.Costa RicaCote d'IvoireCroatiaCyprusCzech RepublicDenmarkDjiboutiDominicaDominican RepublicEarly-demographic dividendEast Asia & PacificEast Asia & Pacific (excluding high income)East Asia & Pacific (IDA & IBRD countries)EcuadorEgypt, Arab Rep.El SalvadorEquatorial GuineaEritreaEstoniaEthiopiaEuro areaEurope & Central AsiaEurope & Central Asia (excluding high income)Europe & Central Asia (IDA & IBRD countries)European UnionFijiFinlandFragile and conflict affected situationsFranceGabonGambia, TheGeorgiaGermanyGhanaGreeceGuatemalaGuineaGuinea-BissauGuyanaHaitiHeavily indebted poor countries (HIPC)High incomeHondurasHungaryIBRD onlyIcelandIDA & IBRD totalIDA blendIDA onlyIDA totalIndiaIndonesiaIran, Islamic Rep.IraqIrelandIsraelItalyJamaicaJapanJordanKazakhstanKenyaKiribatiKorea, Rep.KuwaitKyrgyz RepublicLao PDRLate-demographic dividendLatin America & Caribbean Latin America & Caribbean (excluding high income)Latin America & the Caribbean (IDA & IBRD countries)LatviaLeast developed countries: UN classificationLebanonLesothoLiberiaLibyaLithuaniaLow & middle incomeLow incomeLower middle incomeLuxembourgMacedonia, FYRMadagascarMalawiMalaysiaMaldivesMaliMauritaniaMauritiusMexicoMiddle East & North AfricaMiddle East & North Africa (excluding high income)Middle East & North Africa (IDA & IBRD countries)Middle incomeMoldovaMongoliaMoroccoMozambiqueNamibiaNepalNetherlandsNew ZealandNicaraguaNigerNigeriaNorth AmericaNorwayOECD membersOmanOther small statesPacific island small statesPakistanPanamaPapua New GuineaParaguayPeruPhilippinesPolandPortugalPost-demographic dividendPre-demographic dividendQatarRomaniaRussian FederationRwandaSaudi ArabiaSenegalSeychellesSierra LeoneSingaporeSlovak RepublicSloveniaSmall statesSolomon IslandsSouth AfricaSouth AsiaSouth Asia (IDA & IBRD)SpainSri LankaSt. LuciaSt. Vincent and the GrenadinesSub-Saharan Africa Sub-Saharan Africa (excluding high income)Sub-Saharan Africa (IDA & IBRD countries)SudanSurinameSwazilandSwedenSwitzerlandSyrian Arab RepublicTajikistanTanzaniaThailandTogoTongaTrinidad and TobagoTunisiaTurkeyUgandaUkraineUnited KingdomUnited StatesUpper middle incomeUruguayVanuatuVenezuela, RBVietnamWorldYemen, Rep.ZambiaZimbabwe Timeline:
This timeline shows a graph from 1978 to 2014 of Dominica. No data until 1977. Number of actual observations by date: 37.
Source name:
World Development Indicators
Source organization:
World Bank staff estimates based on sources and methods in World Bank's "The Changing Wealth of Nations: Measuring Sustainable Development in the New Millennium" (2011).
Categories, topics:
Economy & Growth, Environment
Last updated:
apr 23, 2017
Indicators value changes by year
Maximum:
35.048
jan 1, 1980
At the date of observation
Value
Absolute change
Change from previous value
jan 1, 1978
19.407
+19.407
0.0%
jan 1, 1979
22.756
+3.349
17.25%
jan 1, 1980
35.048
+12.292
54.02%
jan 1, 1981
23.721
-11.327
-32.32%
jan 1, 1982
15.506
-8.215
-34.63%
jan 1, 1983
18.614
+3.108
20.04%
jan 1, 1984
25.595
+6.981
37.5%
jan 1, 1985
23.968
-1.627
-6.36%
jan 1, 1986
23.651
-0.317
-1.32%
jan 1, 1987
18.593
-5.058
-21.39%
jan 1, 1988
18.847
+0.254
1.37%
jan 1, 1989
23.014
+4.166
22.11%
jan 1, 1990
11.945
-11.069
-48.1%
jan 1, 1991
17.013
+5.069
42.43%
jan 1, 1992
13.983
-3.03
-17.81%
jan 1, 1993
17.604
+3.62
25.89%
jan 1, 1994
16.607
-0.997
-5.66%
jan 1, 1995
12.475
-4.132
-24.88%
jan 1, 1996
16.819
+4.344
34.82%
jan 1, 1997
15.507
-1.312
-7.8%
jan 1, 1998
15.45
-0.057
-0.37%
jan 1, 1999
19.724
+4.273
27.66%
jan 1, 2000
16.293
-3.43
-17.39%
jan 1, 2001
2.575
-13.718
-84.19%
jan 1, 2002
1.068
-1.508
-58.54%
jan 1, 2003
-1.307
-2.375
-222.4%
jan 1, 2004
1.191
+2.498
-191.14%
jan 1, 2005
2.521
+1.329
111.62%
jan 1, 2006
-0.03
-2.551
-101.21%
jan 1, 2007
7.622
+7.653
-25.17K%
jan 1, 2008
-0.307
-7.929
-104.03%
jan 1, 2009
-6.32
-6.013
1.96K%
jan 1, 2010
-2.273
+4.047
-64.03%
jan 1, 2011
3.421
+5.694
-250.48%
jan 1, 2012
4.24
+0.819
23.94%
jan 1, 2013
-0.929
-5.169
-121.92%
jan 1, 2014
1.505
+2.435
-261.92%
Ranking of countries by current statistics by years


Comments: