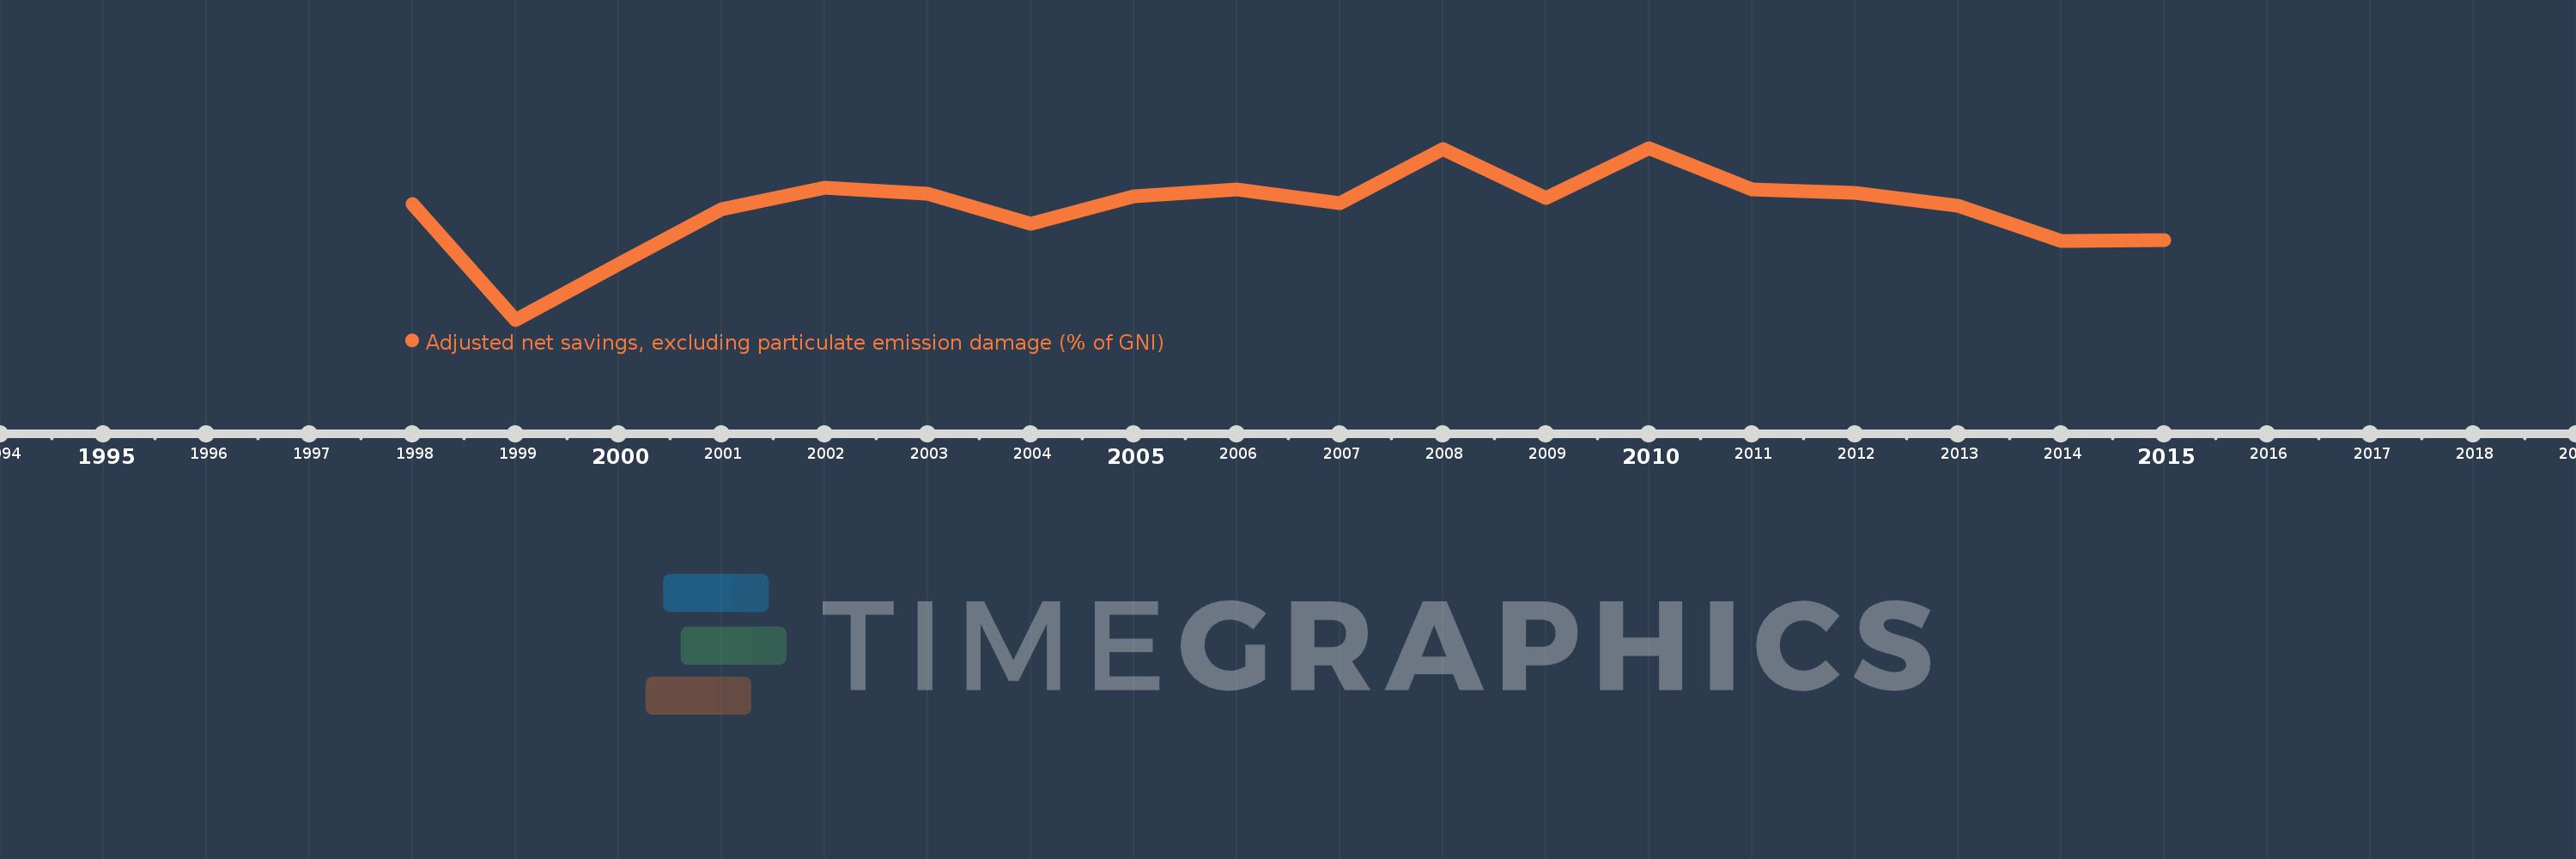
This timeline shows a graph from 1998 to 2015 of Kyrgyz Republic. No data until 1997. Number of actual observations by date: 18.
Source name:
World Development Indicators
Source organization:
World Bank staff estimates based on sources and methods in World Bank's "The Changing Wealth of Nations: Measuring Sustainable Development in the New Millennium" (2011).
Categories, topics:
Economy & Growth, Environment
Last updated:
apr 23, 2017
Indicators value changes by year
Meaning:
1.75
Minimum:
-21.825
jan 1, 1999
Maximum:
14.621
jan 1, 2010
At the date of observation
Value
Absolute change
Change from the previous value
jan 1, 1998
2.744
+2.744
0.0%
jan 1, 1999
-21.825
-24.569
-895.36%
jan 1, 2000
-10.009
+11.816
-54.14%
jan 1, 2001
1.552
+11.562
-115.51%
jan 1, 2002
6.198
+4.646
299.26%
jan 1, 2003
4.884
-1.314
-21.2%
jan 1, 2004
-1.43
-6.314
-129.27%
jan 1, 2005
4.306
+5.735
-401.19%
jan 1, 2006
5.785
+1.479
34.35%
jan 1, 2007
2.9
-2.884
-49.86%
jan 1, 2008
14.47
+11.569
398.87%
jan 1, 2009
4.055
-10.415
-71.97%
jan 1, 2010
14.621
+10.566
260.55%
jan 1, 2011
5.881
-8.74
-59.77%
jan 1, 2012
5.068
-0.813
-13.82%
jan 1, 2013
2.363
-2.706
-53.38%
jan 1, 2014
-5.043
-7.406
-313.44%
jan 1, 2015
-5.018
+0.025
-0.49%
Ranking of countries by current statistics by years
