29
/
en
AIzaSyAYiBZKx7MnpbEhh9jyipgxe19OcubqV5w
April 1, 2024
192672
Mauritania
MRT
true
2
1
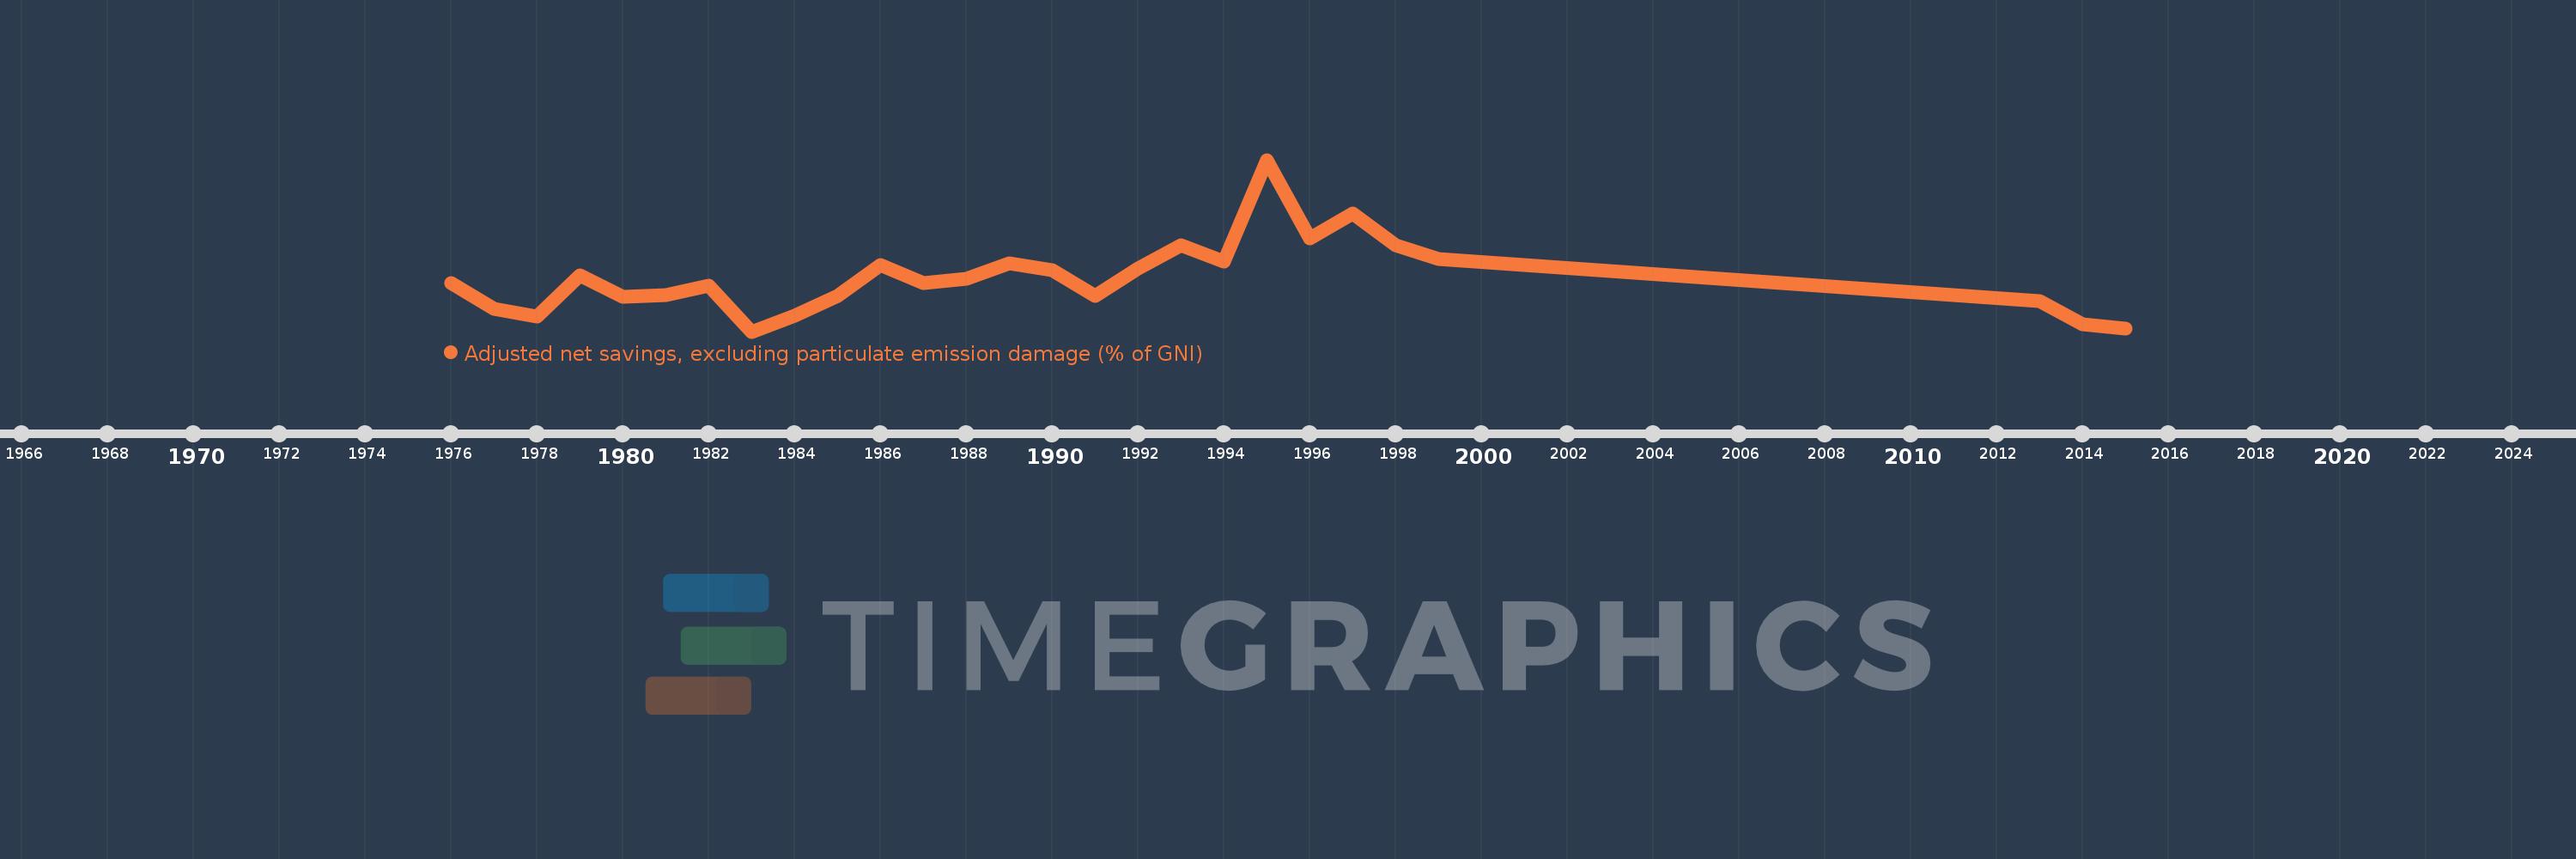
Adjusted net savings, excluding particulate emission damage (% of GNI)
2015,2014,2013,1999,1998,1997,1996,1995,1994,1993,1992,1991,1990,1989,1988,1987,1986,1985,1984,1983,1982,1981,1980,1979,1978,1977,1976
This statistics in other country:
AfghanistanAlbaniaAlgeriaAngolaArab WorldArgentinaArmeniaAustraliaAustriaAzerbaijanBahamas, TheBahrainBangladeshBarbadosBelarusBelgiumBelizeBeninBhutanBoliviaBotswanaBrazilBrunei DarussalamBulgariaBurkina FasoBurundiCabo VerdeCambodiaCameroonCanadaCaribbean small statesCentral African RepublicCentral Europe and the BalticsChadChileChinaColombiaComorosCongo, Dem. Rep.Congo, Rep.Costa RicaCote d'IvoireCroatiaCyprusCzech RepublicDenmarkDjiboutiDominicaDominican RepublicEarly-demographic dividendEast Asia & PacificEast Asia & Pacific (excluding high income)East Asia & Pacific (IDA & IBRD countries)EcuadorEgypt, Arab Rep.El SalvadorEquatorial GuineaEritreaEstoniaEthiopiaEuro areaEurope & Central AsiaEurope & Central Asia (excluding high income)Europe & Central Asia (IDA & IBRD countries)European UnionFijiFinlandFragile and conflict affected situationsFranceGabonGambia, TheGeorgiaGermanyGhanaGreeceGuatemalaGuineaGuinea-BissauGuyanaHaitiHeavily indebted poor countries (HIPC)High incomeHondurasHungaryIBRD onlyIcelandIDA & IBRD totalIDA blendIDA onlyIDA totalIndiaIndonesiaIran, Islamic Rep.IraqIrelandIsraelItalyJamaicaJapanJordanKazakhstanKenyaKiribatiKorea, Rep.KuwaitKyrgyz RepublicLao PDRLate-demographic dividendLatin America & Caribbean Latin America & Caribbean (excluding high income)Latin America & the Caribbean (IDA & IBRD countries)LatviaLeast developed countries: UN classificationLebanonLesothoLiberiaLibyaLithuaniaLow & middle incomeLow incomeLower middle incomeLuxembourgMacedonia, FYRMadagascarMalawiMalaysiaMaldivesMaliMauritaniaMauritiusMexicoMiddle East & North AfricaMiddle East & North Africa (excluding high income)Middle East & North Africa (IDA & IBRD countries)Middle incomeMoldovaMongoliaMoroccoMozambiqueNamibiaNepalNetherlandsNew ZealandNicaraguaNigerNigeriaNorth AmericaNorwayOECD membersOmanOther small statesPacific island small statesPakistanPanamaPapua New GuineaParaguayPeruPhilippinesPolandPortugalPost-demographic dividendPre-demographic dividendQatarRomaniaRussian FederationRwandaSaudi ArabiaSenegalSeychellesSierra LeoneSingaporeSlovak RepublicSloveniaSmall statesSolomon IslandsSouth AfricaSouth AsiaSouth Asia (IDA & IBRD)SpainSri LankaSt. LuciaSt. Vincent and the GrenadinesSub-Saharan Africa Sub-Saharan Africa (excluding high income)Sub-Saharan Africa (IDA & IBRD countries)SudanSurinameSwazilandSwedenSwitzerlandSyrian Arab RepublicTajikistanTanzaniaThailandTogoTongaTrinidad and TobagoTunisiaTurkeyUgandaUkraineUnited KingdomUnited StatesUpper middle incomeUruguayVanuatuVenezuela, RBVietnamWorldYemen, Rep.ZambiaZimbabwe Timeline:
This timeline shows a graph from 1976 to 2015 of Mauritania. No data until 1975. Number of actual observations by date: 27.
Source name:
World Development Indicators
Source organization:
World Bank staff estimates based on sources and methods in World Bank's "The Changing Wealth of Nations: Measuring Sustainable Development in the New Millennium" (2011).
Categories, topics:
Economy & Growth, Environment
Last updated:
apr 23, 2017
Indicators value changes by year
Minimum:
-16.482
jan 1, 1983
Maximum:
47.976
jan 1, 1995
At the date of observation
Value
Absolute change
Change from previous value
jan 1, 1976
1.778
+1.778
0.0%
jan 1, 1977
-7.949
-9.727
-547.03%
jan 1, 1978
-10.832
-2.883
36.27%
jan 1, 1979
4.503
+15.335
-141.57%
jan 1, 1980
-3.563
-8.066
-179.11%
jan 1, 1981
-2.804
+0.759
-21.3%
jan 1, 1982
0.822
+3.626
-129.31%
jan 1, 1983
-16.482
-17.304
-2.11K%
jan 1, 1984
-10.444
+6.038
-36.63%
jan 1, 1985
-3.022
+7.422
-71.06%
jan 1, 1986
8.615
+11.638
-385.05%
jan 1, 1987
1.585
-7.03
-81.6%
jan 1, 1988
3.28
+1.695
106.97%
jan 1, 1989
9.247
+5.967
181.9%
jan 1, 1990
6.607
-2.64
-28.55%
jan 1, 1991
-3.007
-9.614
-145.51%
jan 1, 1992
7.231
+10.237
-340.5%
jan 1, 1993
16.066
+8.835
122.19%
jan 1, 1994
9.783
-6.283
-39.11%
jan 1, 1995
47.976
+38.193
390.4%
jan 1, 1996
18.457
-29.519
-61.53%
jan 1, 1997
27.744
+9.287
50.32%
jan 1, 1998
15.809
-11.935
-43.02%
jan 1, 1999
10.903
-4.906
-31.03%
jan 1, 2013
-5.155
-16.058
-147.28%
jan 1, 2014
-13.777
-8.623
167.28%
jan 1, 2015
-15.411
-1.634
11.86%
Ranking of countries by current statistics by years


Comments: