30
/
AIzaSyAYiBZKx7MnpbEhh9jyipgxe19OcubqV5w
April 1, 2024
90244
Botswana
BWA
true
2
1
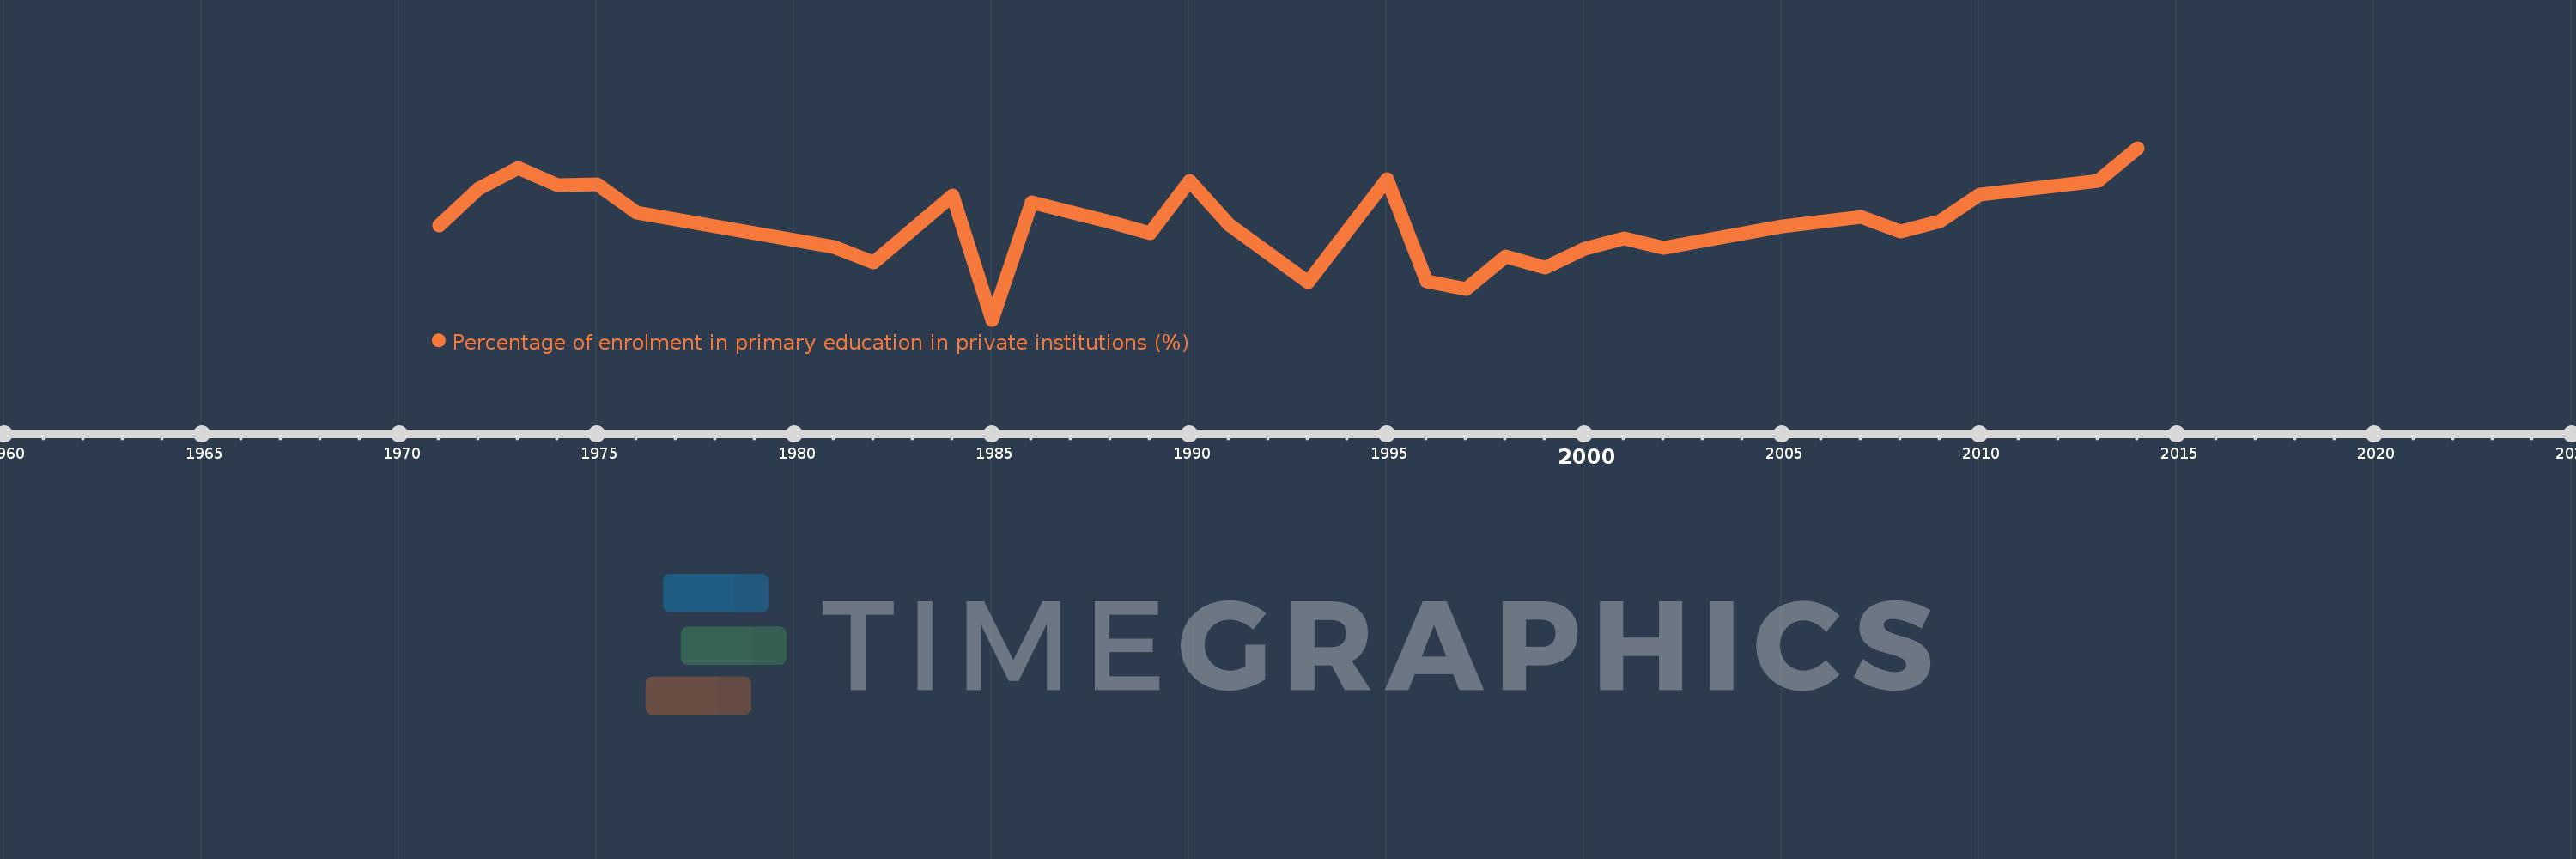
Percentage of enrolment in primary education in private institutions (%)
2014,2013,2010,2009,2008,2007,2005,2002,2001,2000,1999,1998,1997,1996,1995,1993,1991,1990,1989,1988,1986,1985,1984,1982,1981,1976,1975,1974,1973,1972,1971
