30
/
AIzaSyAYiBZKx7MnpbEhh9jyipgxe19OcubqV5w
April 1, 2024
84538
Benin
BEN
true
2
1
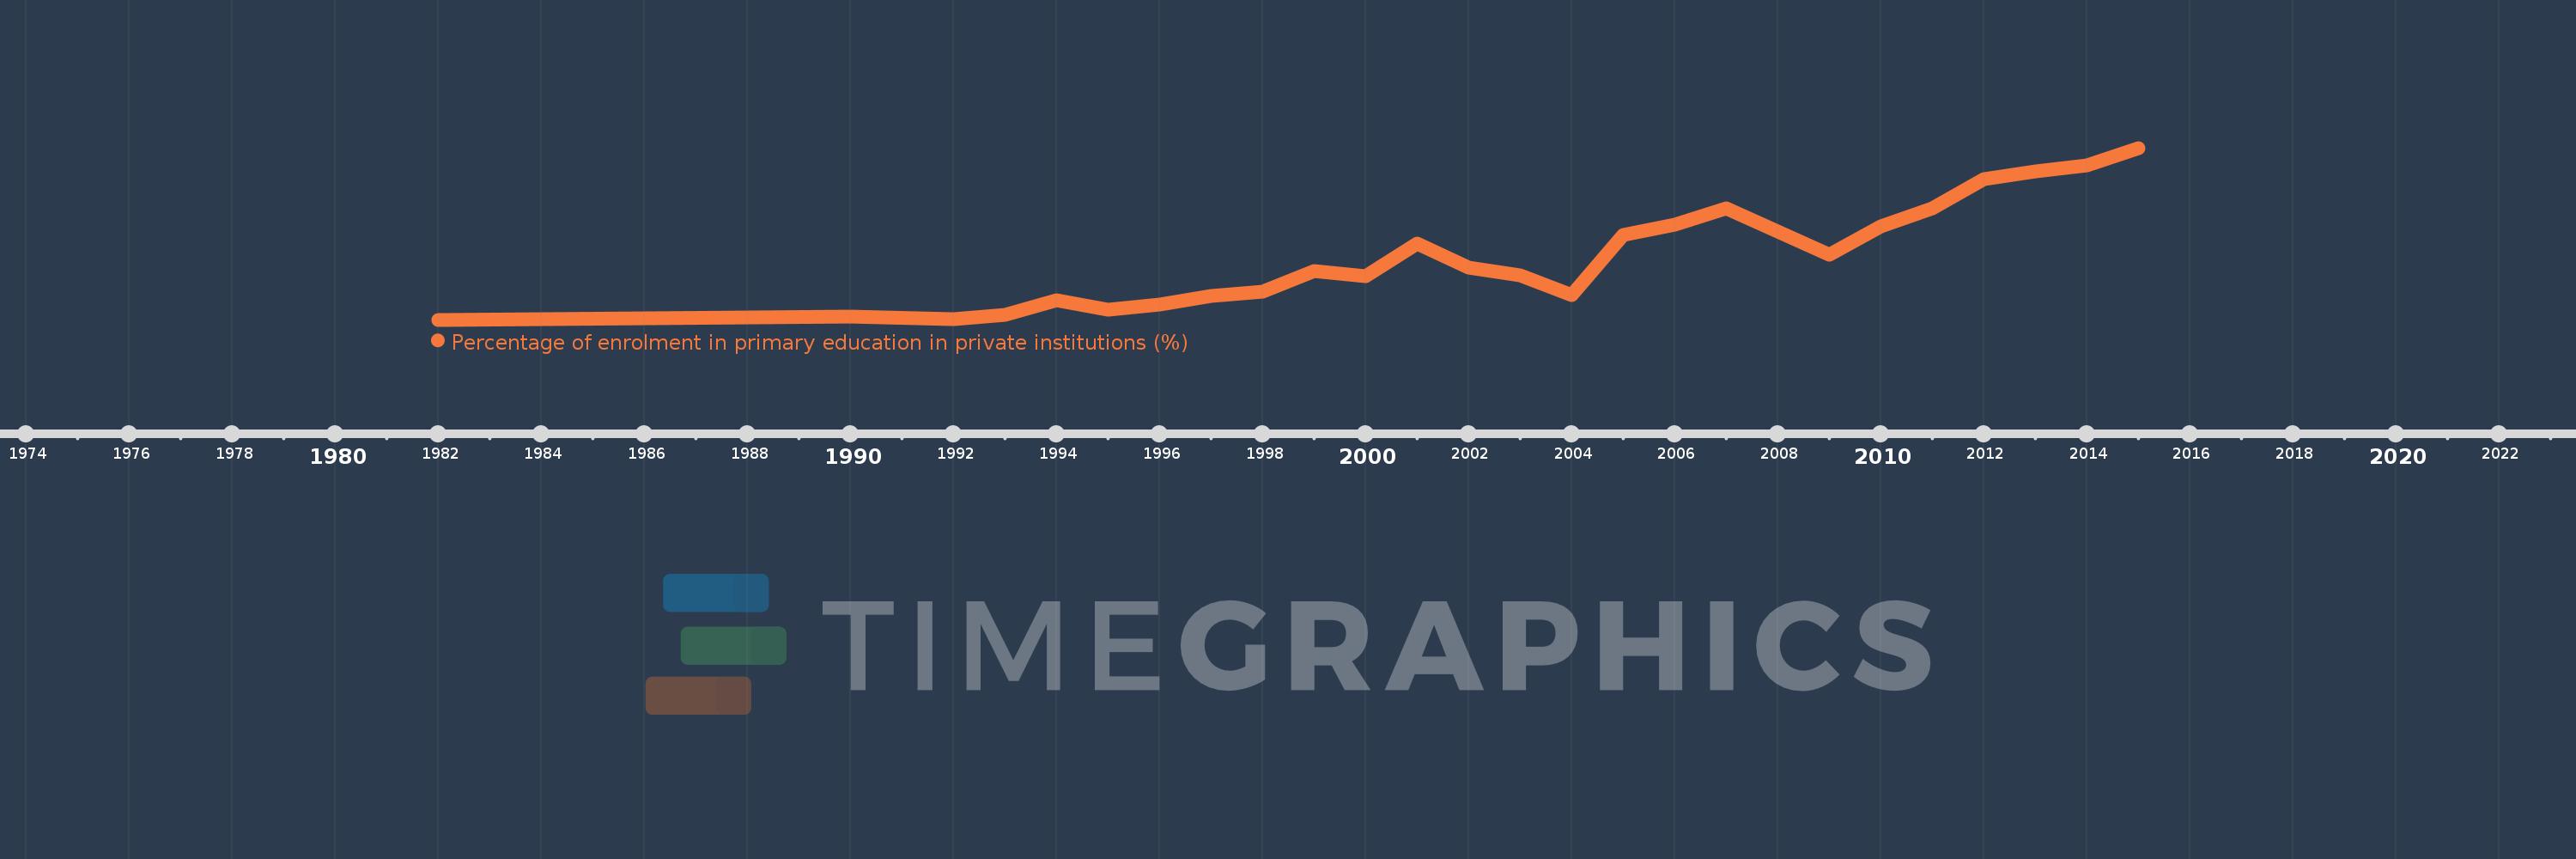
Percentage of enrolment in primary education in private institutions (%)
2015,2014,2013,2012,2011,2010,2009,2007,2006,2005,2004,2003,2002,2001,2000,1999,1998,1997,1996,1995,1994,1993,1992,1990,1982
