29
/
en
AIzaSyAYiBZKx7MnpbEhh9jyipgxe19OcubqV5w
April 1, 2024
144853
Guatemala
GTM
true
2
1
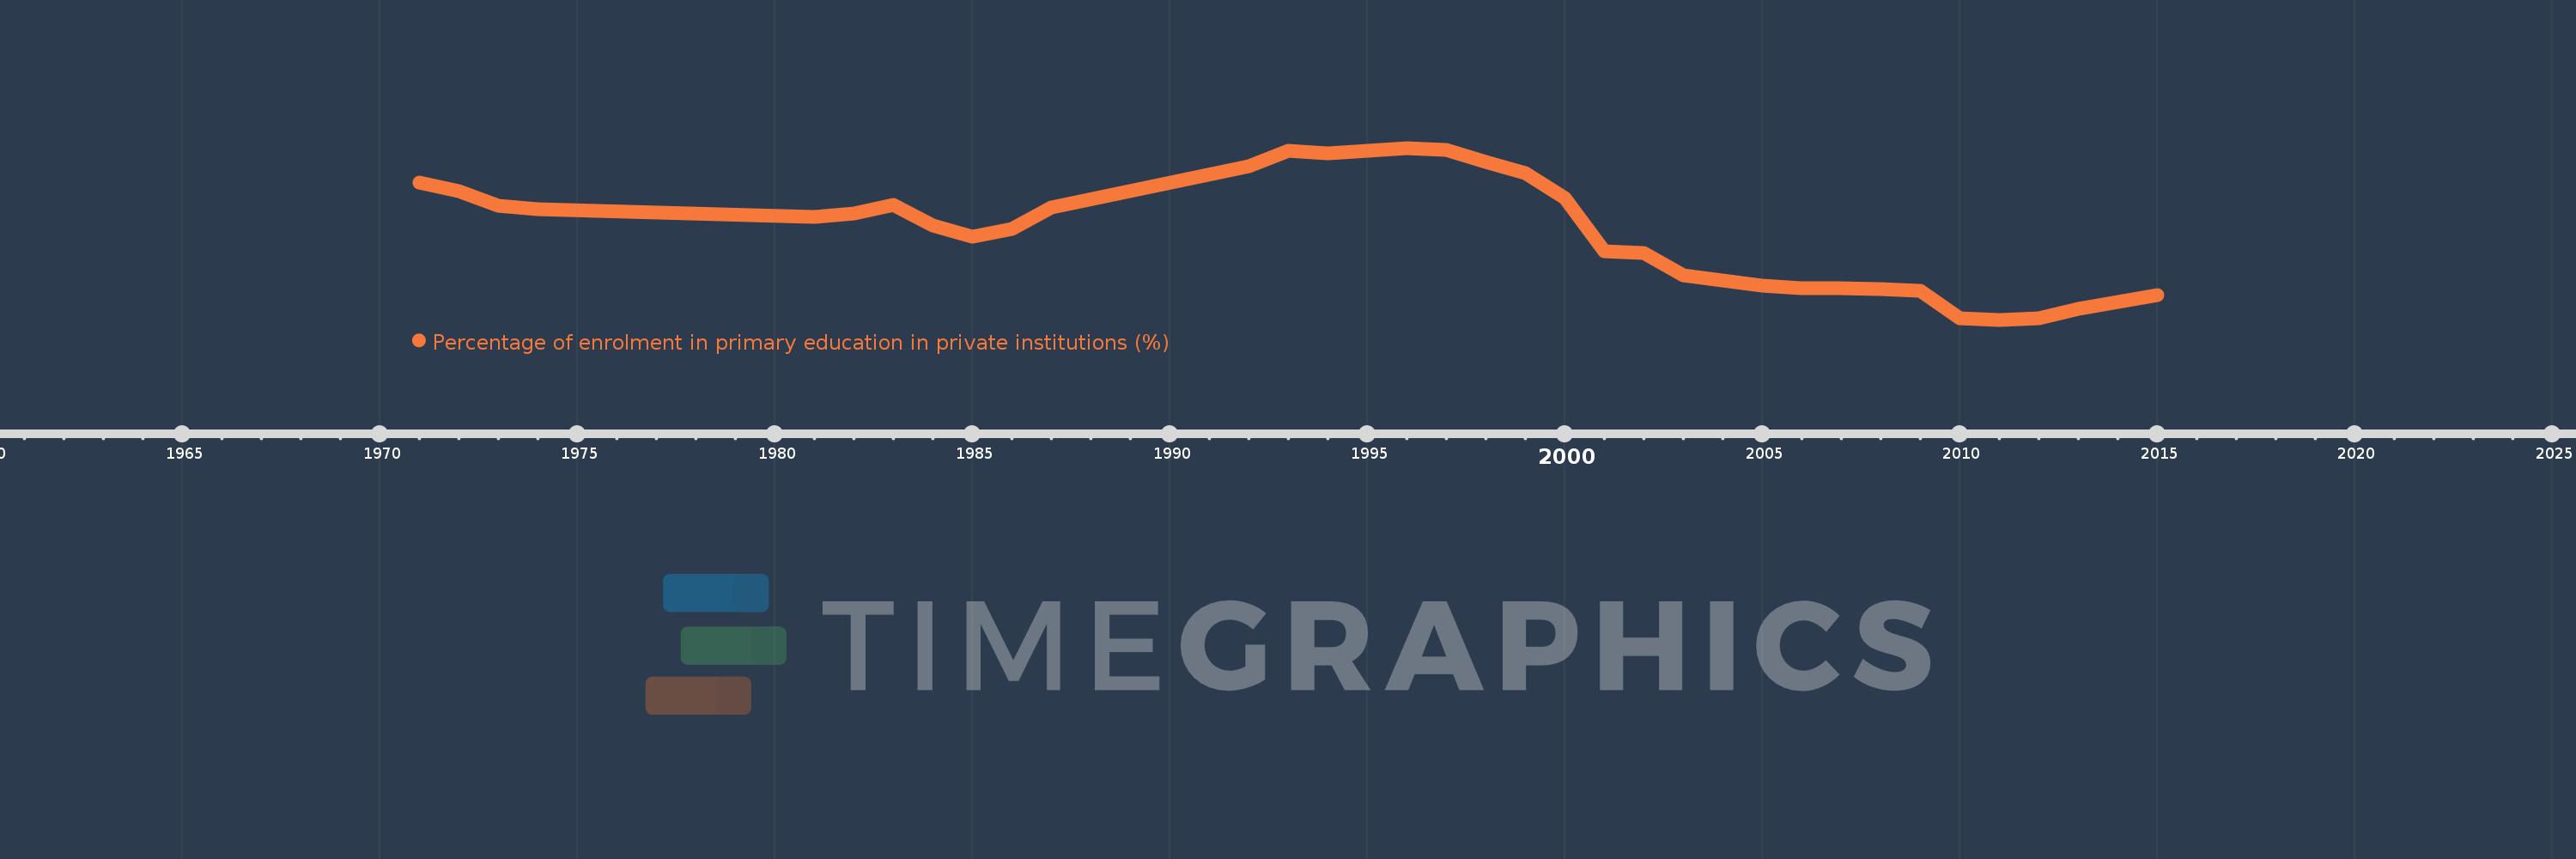
Percentage of enrolment in primary education in private institutions (%)
2015,2013,2012,2011,2010,2009,2008,2007,2006,2005,2003,2002,2001,2000,1999,1998,1997,1996,1994,1993,1992,1987,1986,1985,1984,1983,1982,1981,1974,1973,1972,1971
This statistics in other country:
AfghanistanAlbaniaAlgeriaAndorraAngolaAntigua and BarbudaArab WorldArgentinaArmeniaArubaAustraliaAustriaAzerbaijanBahamas, TheBahrainBangladeshBarbadosBelarusBelgiumBelizeBeninBermudaBhutanBoliviaBosnia and HerzegovinaBotswanaBrazilBritish Virgin IslandsBrunei DarussalamBulgariaBurkina FasoBurundiCabo VerdeCambodiaCameroonCanadaCaribbean small statesCayman IslandsCentral African RepublicCentral Europe and the BalticsChadChileChinaColombiaComorosCongo, Dem. Rep.Congo, Rep.Costa RicaCote d'IvoireCroatiaCubaCuracaoCyprusCzech RepublicDenmarkDjiboutiDominicaDominican RepublicEarly-demographic dividendEast Asia & PacificEast Asia & Pacific (excluding high income)East Asia & Pacific (IDA & IBRD countries)EcuadorEgypt, Arab Rep.El SalvadorEquatorial GuineaEritreaEstoniaEthiopiaEuro areaEurope & Central AsiaEurope & Central Asia (excluding high income)Europe & Central Asia (IDA & IBRD countries)European UnionFijiFinlandFragile and conflict affected situationsFranceGabonGambia, TheGeorgiaGermanyGhanaGibraltarGreeceGrenadaGuatemalaGuineaGuinea-BissauGuyanaHaitiHeavily indebted poor countries (HIPC)High incomeHondurasHong Kong SAR, ChinaHungaryIBRD onlyIcelandIDA & IBRD totalIDA blendIDA onlyIDA totalIndiaIndonesiaIran, Islamic Rep.IraqIrelandIsraelItalyJamaicaJapanJordanKazakhstanKenyaKiribatiKorea, Rep.KuwaitKyrgyz RepublicLao PDRLate-demographic dividendLatin America & Caribbean Latin America & Caribbean (excluding high income)Latin America & the Caribbean (IDA & IBRD countries)LatviaLeast developed countries: UN classificationLebanonLesothoLiberiaLibyaLiechtensteinLithuaniaLow & middle incomeLow incomeLower middle incomeLuxembourgMacao SAR, ChinaMacedonia, FYRMadagascarMalawiMalaysiaMaldivesMaliMaltaMarshall IslandsMauritaniaMauritiusMexicoMiddle East & North AfricaMiddle East & North Africa (excluding high income)Middle East & North Africa (IDA & IBRD countries)Middle incomeMoldovaMonacoMongoliaMoroccoMozambiqueMyanmarNamibiaNauruNepalNetherlandsNew ZealandNicaraguaNigerNigeriaNorth AmericaNorwayOECD membersOmanOther small statesPacific island small statesPakistanPalauPanamaPapua New GuineaParaguayPeruPhilippinesPolandPortugalPost-demographic dividendPre-demographic dividendPuerto RicoQatarRomaniaRussian FederationRwandaSamoaSan MarinoSao Tome and PrincipeSaudi ArabiaSenegalSerbiaSeychellesSierra LeoneSingaporeSlovak RepublicSloveniaSmall statesSolomon IslandsSomaliaSouth AfricaSouth AsiaSouth Asia (IDA & IBRD)SpainSri LankaSt. Kitts and NevisSt. LuciaSt. Vincent and the GrenadinesSub-Saharan Africa Sub-Saharan Africa (excluding high income)Sub-Saharan Africa (IDA & IBRD countries)SudanSurinameSwazilandSwedenSwitzerlandSyrian Arab RepublicTajikistanTanzaniaThailandTimor-LesteTogoTongaTrinidad and TobagoTunisiaTurkeyTurks and Caicos IslandsTuvaluUgandaUkraineUnited Arab EmiratesUnited KingdomUnited StatesUpper middle incomeUruguayVanuatuVenezuela, RBVietnamWest Bank and GazaWorldYemen, Rep.ZambiaZimbabwe Timeline:
This timeline shows a graph from 1971 to 2015 of Guatemala. No data until 1970. Number of actual observations by date: 32.
Source name:
World Development Indicators
Source organization:
UNESCO Institute for Statistics
Categories, topics:
Education
Last updated:
apr 23, 2017
Indicators value changes by year
Minimum:
10.169
jan 1, 2011
Maximum:
16.894
jan 1, 1996
At the date of observation
Value
Absolute change
Change from previous value
jan 1, 1971
15.536
+15.536
0.0%
jan 1, 1972
15.19
-0.346
-2.23%
jan 1, 1973
14.627
-0.564
-3.71%
jan 1, 1974
14.48
-0.146
-1.0%
jan 1, 1981
14.187
-0.293
-2.02%
jan 1, 1982
14.324
+0.137
0.96%
jan 1, 1983
14.673
+0.349
2.44%
jan 1, 1984
13.86
-0.813
-5.54%
jan 1, 1985
13.434
-0.426
-3.07%
jan 1, 1986
13.714
+0.28
2.09%
jan 1, 1987
14.571
+0.857
6.25%
jan 1, 1992
16.176
+1.605
11.01%
jan 1, 1993
16.795
+0.619
3.83%
jan 1, 1994
16.67
-0.125
-0.74%
jan 1, 1996
16.894
+0.223
1.34%
jan 1, 1997
16.801
-0.092
-0.55%
jan 1, 1998
16.334
-0.467
-2.78%
jan 1, 1999
15.911
-0.423
-2.59%
jan 1, 2000
14.924
-0.987
-6.2%
jan 1, 2001
12.841
-2.083
-13.96%
jan 1, 2002
12.774
-0.067
-0.52%
jan 1, 2003
11.913
-0.861
-6.74%
jan 1, 2005
11.497
-0.417
-3.5%
jan 1, 2006
11.394
-0.103
-0.89%
jan 1, 2007
11.388
-0.006
-0.05%
jan 1, 2008
11.365
-0.023
-0.2%
jan 1, 2009
11.298
-0.067
-0.59%
jan 1, 2010
10.219
-1.079
-9.55%
jan 1, 2011
10.169
-0.05
-0.49%
jan 1, 2012
10.212
+0.043
0.42%
jan 1, 2013
10.609
+0.397
3.89%
jan 1, 2015
11.127
+0.518
4.88%
Ranking of countries by current statistics by years


Comments: