29
/
en
AIzaSyAYiBZKx7MnpbEhh9jyipgxe19OcubqV5w
April 1, 2024
39333
IDA only
IDX
false
2
1
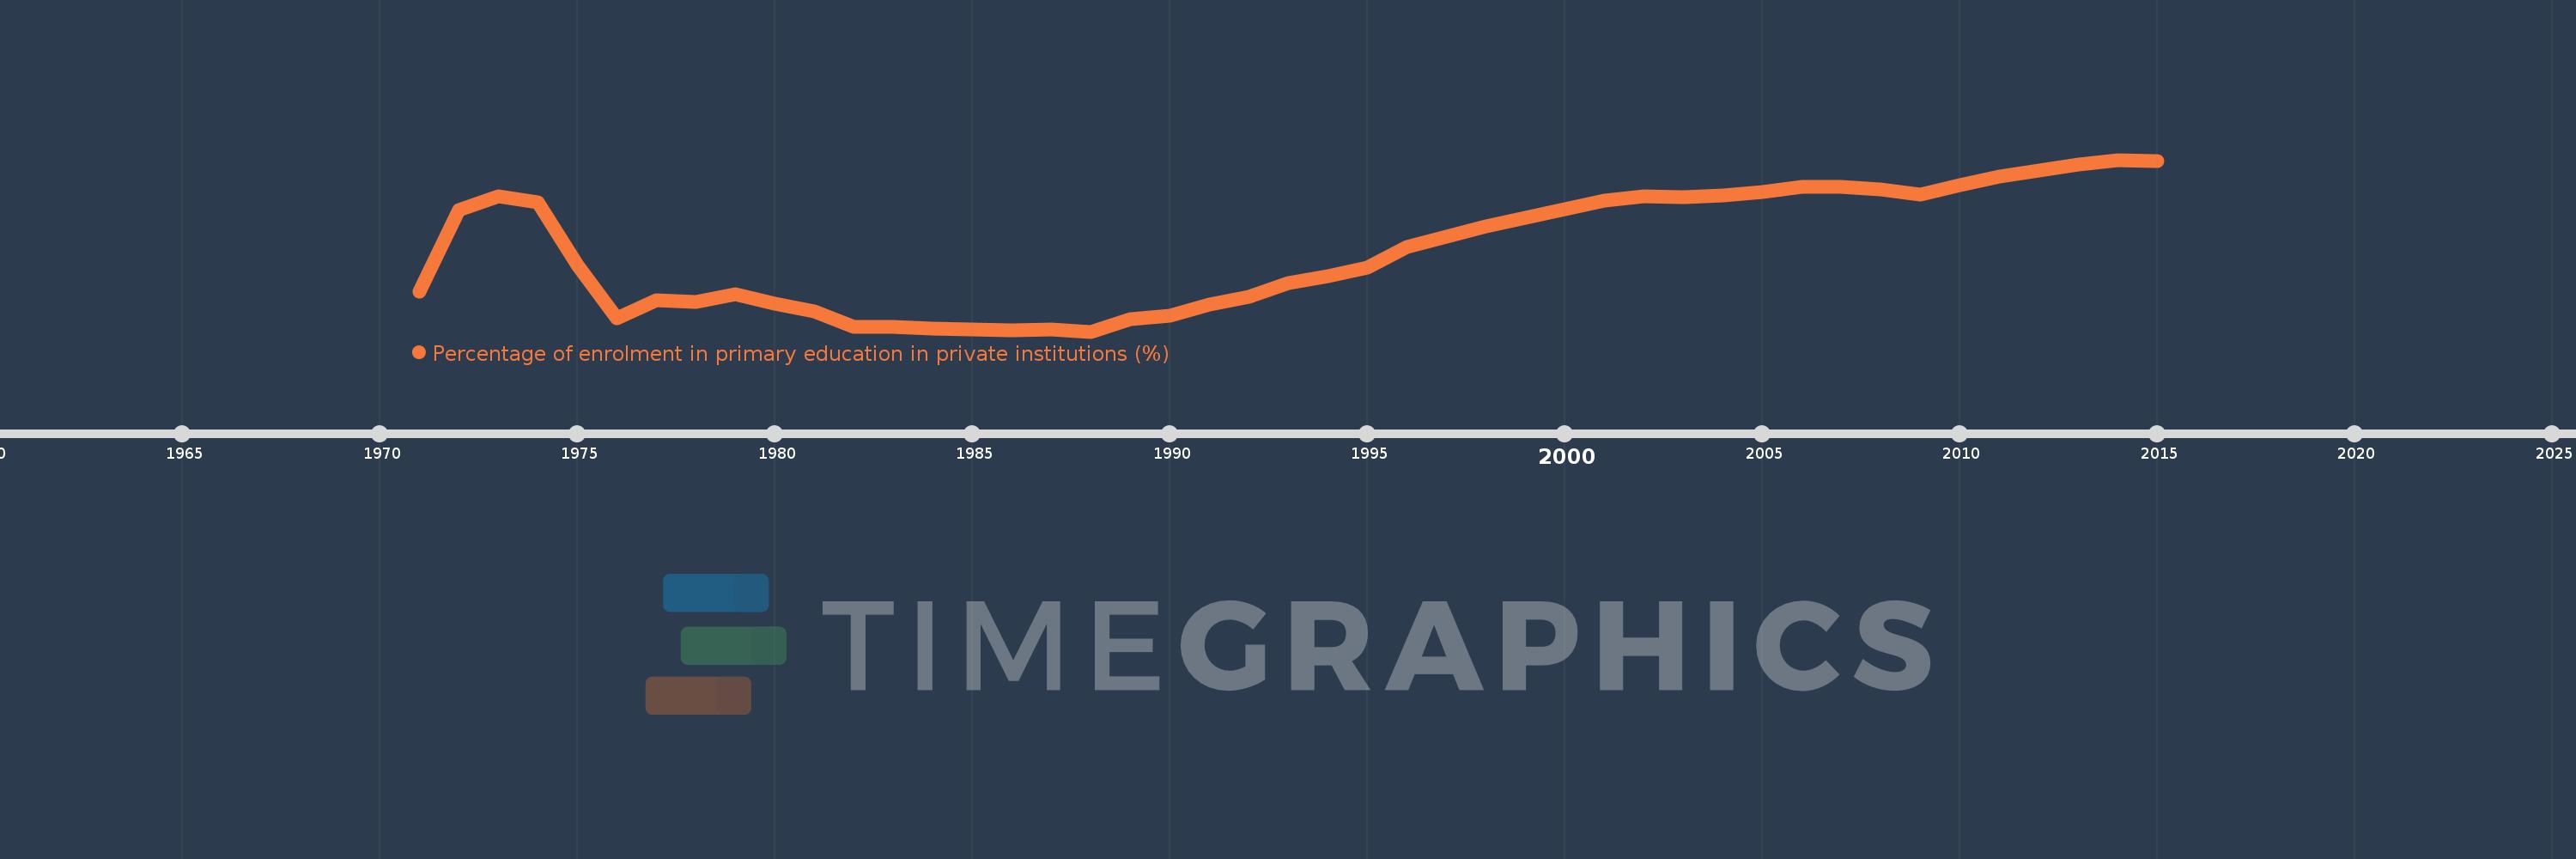
Percentage of enrolment in primary education in private institutions (%)
2015,2014,2013,2012,2011,2010,2009,2008,2007,2006,2005,2004,2003,2002,2001,2000,1999,1998,1997,1996,1995,1994,1993,1992,1991,1990,1989,1988,1987,1986,1985,1984,1983,1982,1981,1980,1979,1978,1977,1976,1975,1974,1973,1972,1971
This statistics in other country:
AfghanistanAlbaniaAlgeriaAndorraAngolaAntigua and BarbudaArab WorldArgentinaArmeniaArubaAustraliaAustriaAzerbaijanBahamas, TheBahrainBangladeshBarbadosBelarusBelgiumBelizeBeninBermudaBhutanBoliviaBosnia and HerzegovinaBotswanaBrazilBritish Virgin IslandsBrunei DarussalamBulgariaBurkina FasoBurundiCabo VerdeCambodiaCameroonCanadaCaribbean small statesCayman IslandsCentral African RepublicCentral Europe and the BalticsChadChileChinaColombiaComorosCongo, Dem. Rep.Congo, Rep.Costa RicaCote d'IvoireCroatiaCubaCuracaoCyprusCzech RepublicDenmarkDjiboutiDominicaDominican RepublicEarly-demographic dividendEast Asia & PacificEast Asia & Pacific (excluding high income)East Asia & Pacific (IDA & IBRD countries)EcuadorEgypt, Arab Rep.El SalvadorEquatorial GuineaEritreaEstoniaEthiopiaEuro areaEurope & Central AsiaEurope & Central Asia (excluding high income)Europe & Central Asia (IDA & IBRD countries)European UnionFijiFinlandFragile and conflict affected situationsFranceGabonGambia, TheGeorgiaGermanyGhanaGibraltarGreeceGrenadaGuatemalaGuineaGuinea-BissauGuyanaHaitiHeavily indebted poor countries (HIPC)High incomeHondurasHong Kong SAR, ChinaHungaryIBRD onlyIcelandIDA & IBRD totalIDA blendIDA onlyIDA totalIndiaIndonesiaIran, Islamic Rep.IraqIrelandIsraelItalyJamaicaJapanJordanKazakhstanKenyaKiribatiKorea, Rep.KuwaitKyrgyz RepublicLao PDRLate-demographic dividendLatin America & Caribbean Latin America & Caribbean (excluding high income)Latin America & the Caribbean (IDA & IBRD countries)LatviaLeast developed countries: UN classificationLebanonLesothoLiberiaLibyaLiechtensteinLithuaniaLow & middle incomeLow incomeLower middle incomeLuxembourgMacao SAR, ChinaMacedonia, FYRMadagascarMalawiMalaysiaMaldivesMaliMaltaMarshall IslandsMauritaniaMauritiusMexicoMiddle East & North AfricaMiddle East & North Africa (excluding high income)Middle East & North Africa (IDA & IBRD countries)Middle incomeMoldovaMonacoMongoliaMoroccoMozambiqueMyanmarNamibiaNauruNepalNetherlandsNew ZealandNicaraguaNigerNigeriaNorth AmericaNorwayOECD membersOmanOther small statesPacific island small statesPakistanPalauPanamaPapua New GuineaParaguayPeruPhilippinesPolandPortugalPost-demographic dividendPre-demographic dividendPuerto RicoQatarRomaniaRussian FederationRwandaSamoaSan MarinoSao Tome and PrincipeSaudi ArabiaSenegalSerbiaSeychellesSierra LeoneSingaporeSlovak RepublicSloveniaSmall statesSolomon IslandsSomaliaSouth AfricaSouth AsiaSouth Asia (IDA & IBRD)SpainSri LankaSt. Kitts and NevisSt. LuciaSt. Vincent and the GrenadinesSub-Saharan Africa Sub-Saharan Africa (excluding high income)Sub-Saharan Africa (IDA & IBRD countries)SudanSurinameSwazilandSwedenSwitzerlandSyrian Arab RepublicTajikistanTanzaniaThailandTimor-LesteTogoTongaTrinidad and TobagoTunisiaTurkeyTurks and Caicos IslandsTuvaluUgandaUkraineUnited Arab EmiratesUnited KingdomUnited StatesUpper middle incomeUruguayVanuatuVenezuela, RBVietnamWest Bank and GazaWorldYemen, Rep.ZambiaZimbabwe Timeline:
This timeline shows a graph from 1971 to 2015 of IDA only. No data until 1970. Number of actual observations by date: 45.
Source name:
World Development Indicators
Source organization:
UNESCO Institute for Statistics
Categories, topics:
Education
Last updated:
apr 23, 2017
Indicators value changes by year
Maximum:
14.428
jan 1, 2014
At the date of observation
Value
Absolute change
Change from previous value
jan 1, 1971
8.479
+8.479
0.0%
jan 1, 1972
12.165
+3.686
43.48%
jan 1, 1973
12.779
+0.614
5.05%
jan 1, 1974
12.52
-0.259
-2.03%
jan 1, 1975
9.696
-2.824
-22.56%
jan 1, 1976
7.268
-2.428
-25.04%
jan 1, 1977
8.085
+0.817
11.25%
jan 1, 1978
7.995
-0.091
-1.12%
jan 1, 1979
8.378
+0.383
4.79%
jan 1, 1980
7.948
-0.43
-5.13%
jan 1, 1981
7.597
-0.352
-4.43%
jan 1, 1982
6.882
-0.714
-9.4%
jan 1, 1983
6.872
-0.01
-0.15%
jan 1, 1984
6.802
-0.071
-1.03%
jan 1, 1985
6.783
-0.018
-0.27%
jan 1, 1986
6.75
-0.033
-0.49%
jan 1, 1987
6.776
+0.026
0.38%
jan 1, 1988
6.677
-0.099
-1.47%
jan 1, 1989
7.242
+0.565
8.46%
jan 1, 1990
7.376
+0.134
1.85%
jan 1, 1991
7.89
+0.514
6.97%
jan 1, 1992
8.233
+0.343
4.34%
jan 1, 1993
8.855
+0.622
7.56%
jan 1, 1994
9.174
+0.319
3.61%
jan 1, 1995
9.552
+0.378
4.12%
jan 1, 1996
10.487
+0.935
9.79%
jan 1, 1997
10.957
+0.47
4.48%
jan 1, 1998
11.428
+0.47
4.29%
jan 1, 1999
11.814
+0.386
3.38%
jan 1, 2000
12.215
+0.401
3.4%
jan 1, 2001
12.593
+0.378
3.09%
jan 1, 2002
12.762
+0.17
1.35%
jan 1, 2003
12.737
-0.025
-0.2%
jan 1, 2004
12.814
+0.077
0.6%
jan 1, 2005
12.974
+0.16
1.25%
jan 1, 2006
13.218
+0.245
1.89%
jan 1, 2007
13.226
+0.007
0.06%
jan 1, 2008
13.107
-0.118
-0.9%
jan 1, 2009
12.852
-0.256
-1.95%
jan 1, 2010
13.283
+0.431
3.36%
jan 1, 2011
13.683
+0.4
3.01%
jan 1, 2012
13.954
+0.271
1.98%
jan 1, 2013
14.223
+0.268
1.92%
jan 1, 2014
14.428
+0.205
1.44%
jan 1, 2015
14.377
-0.051
-0.35%
Ranking of countries by current statistics by years


Comments: