30
/
AIzaSyAYiBZKx7MnpbEhh9jyipgxe19OcubqV5w
April 1, 2024
85357
Bermuda
BMU
true
2
1
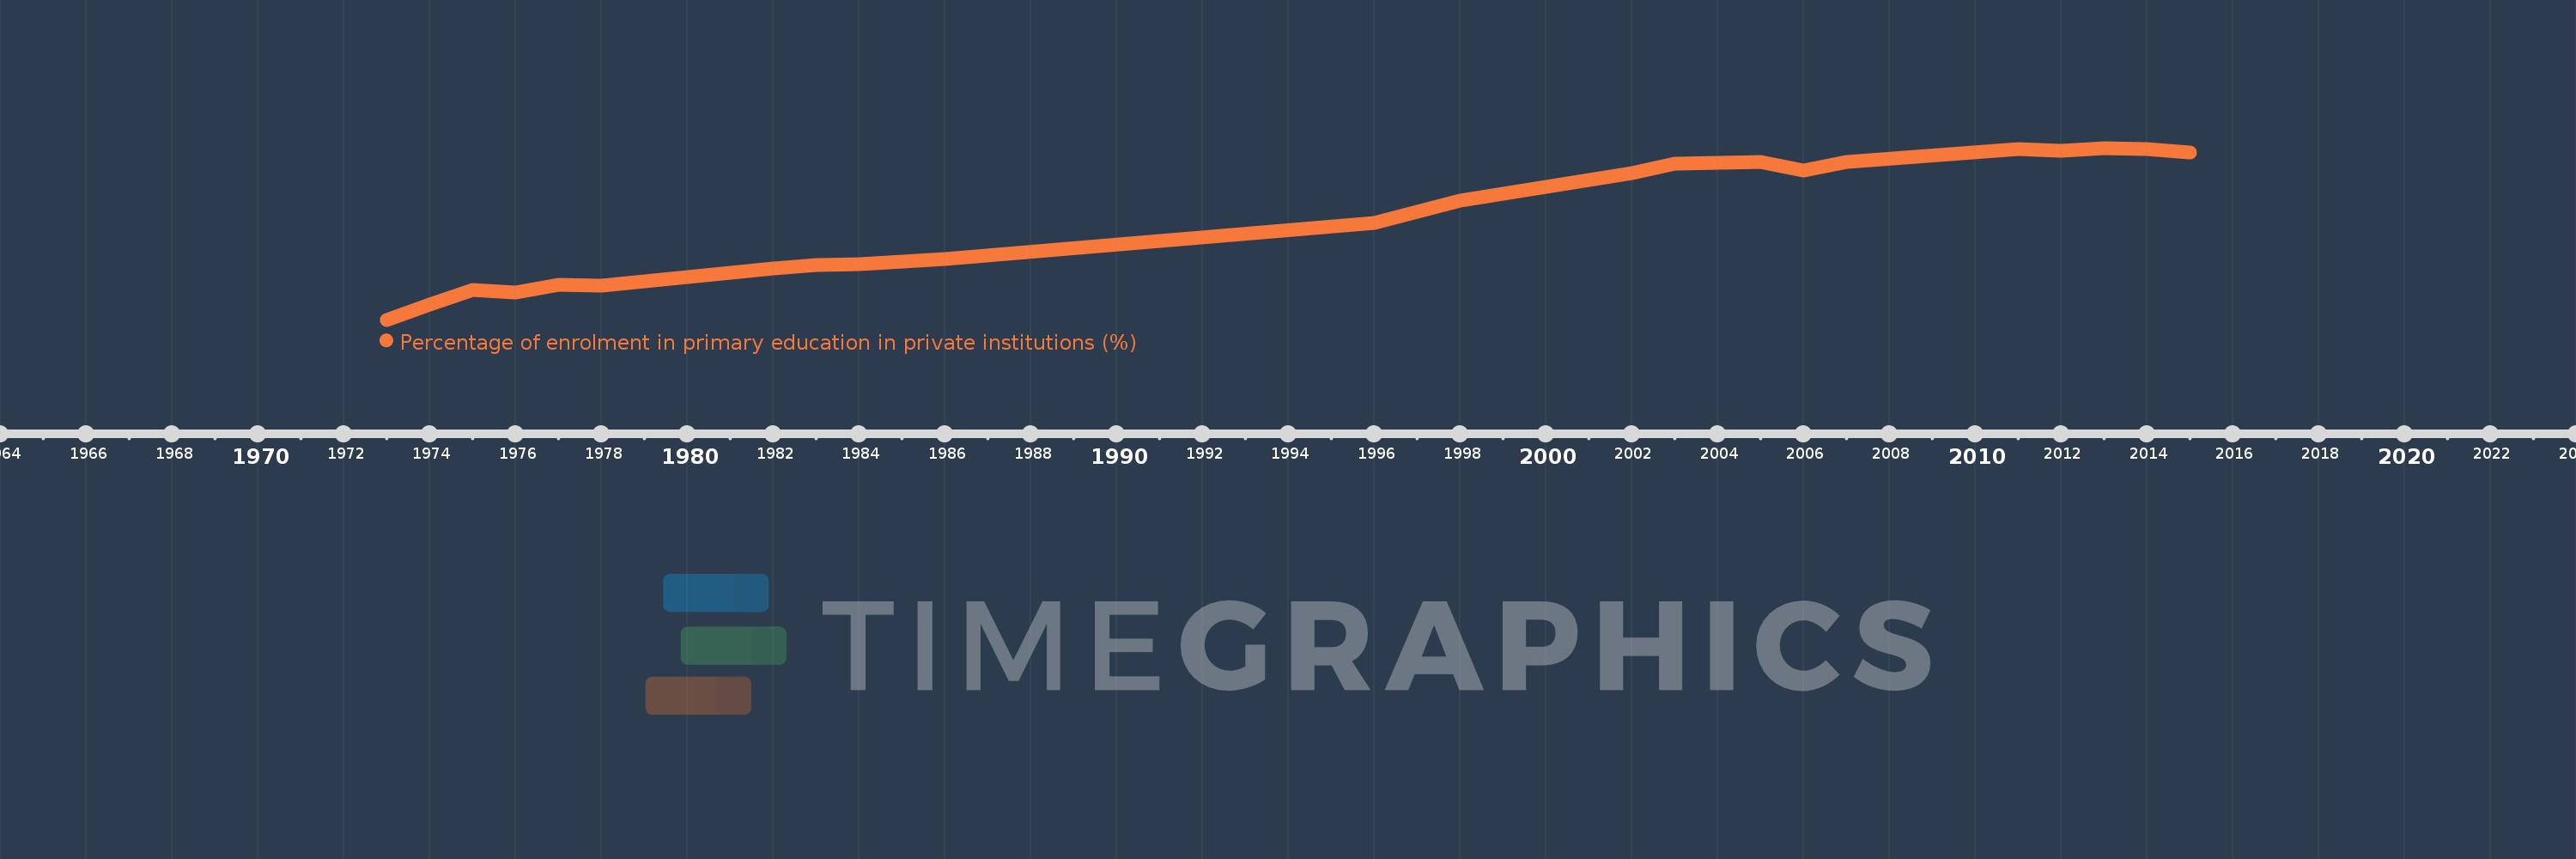
Percentage of enrolment in primary education in private institutions (%)
2015,2014,2013,2012,2011,2007,2006,2005,2004,2003,2002,1998,1996,1986,1985,1984,1983,1982,1978,1977,1976,1975,1974,1973
