29
/
en
AIzaSyAYiBZKx7MnpbEhh9jyipgxe19OcubqV5w
April 1, 2024
156468
Indonesia
IDN
true
2
1
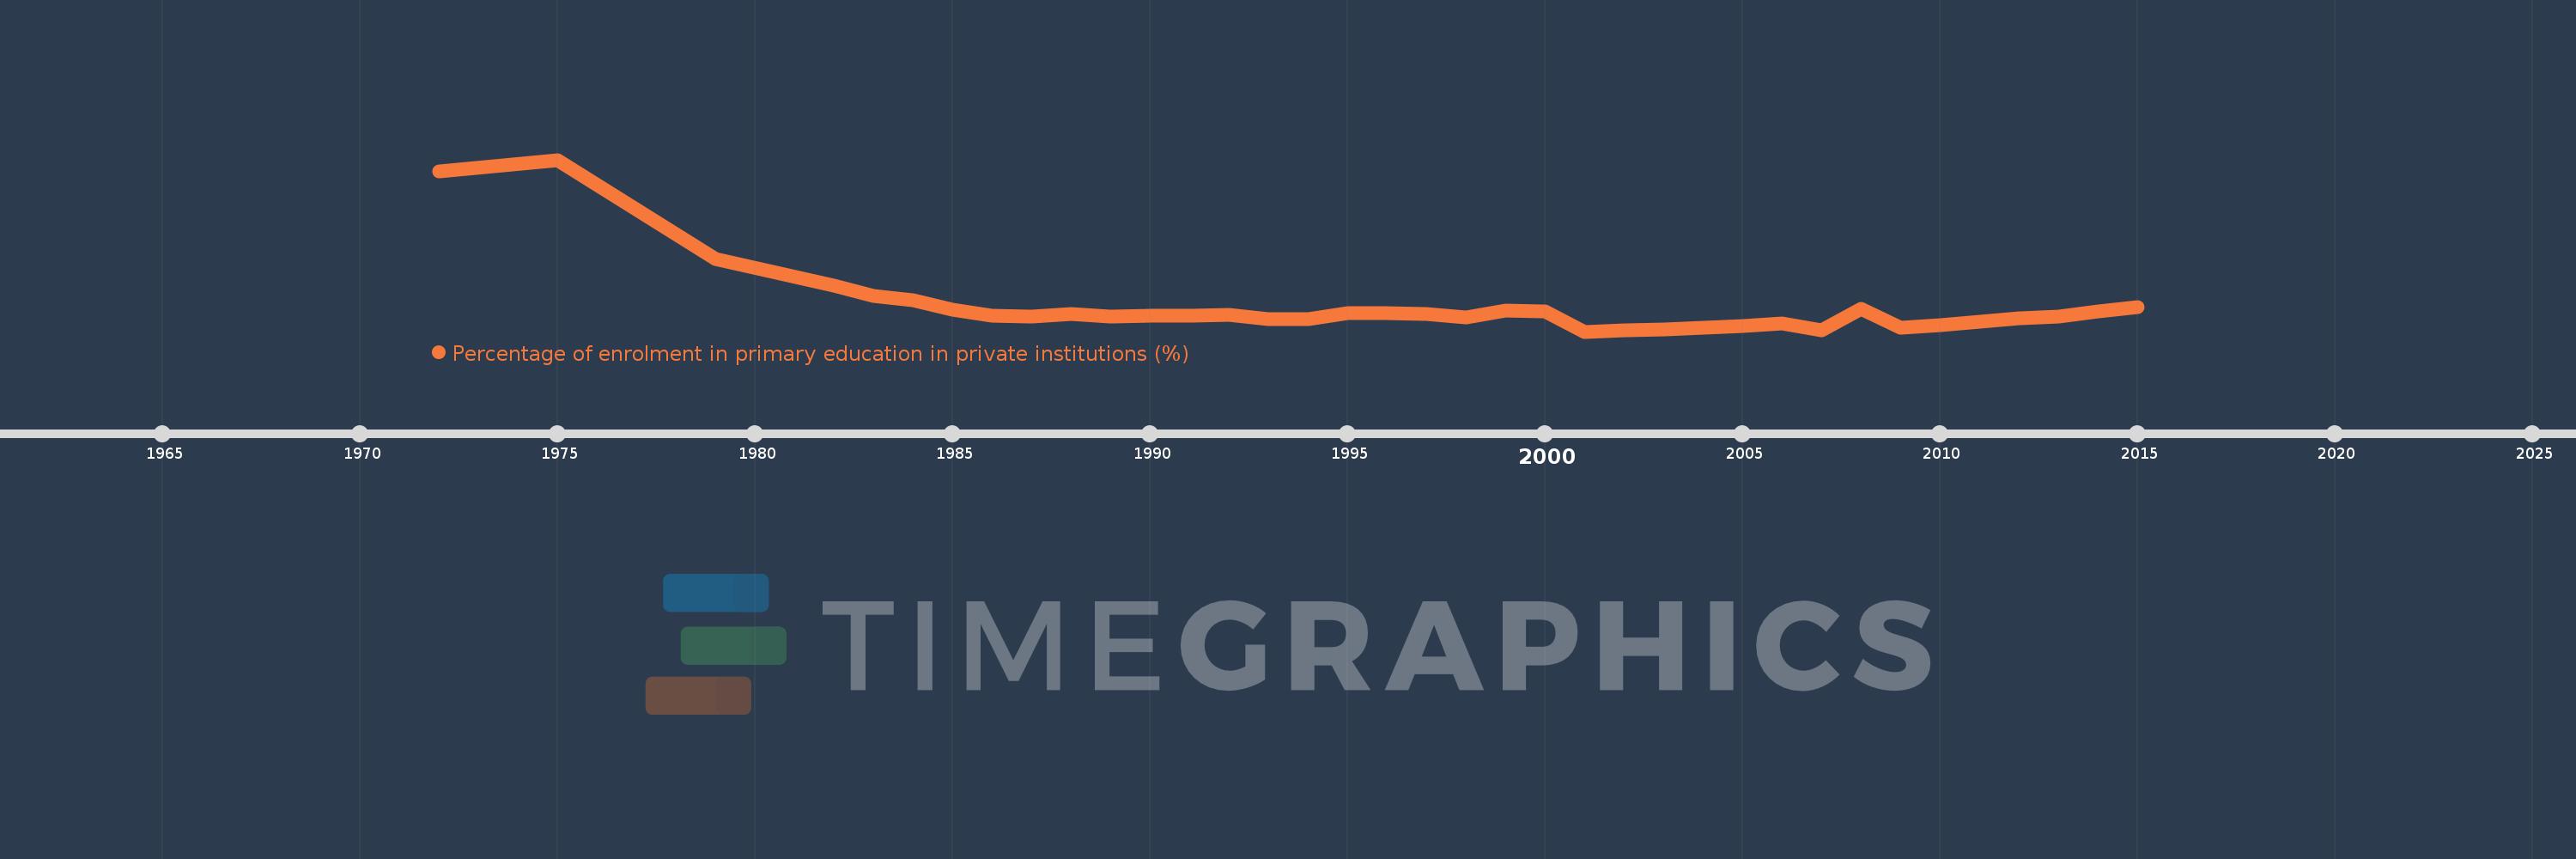
Percentage of enrolment in primary education in private institutions (%)
2015,2014,2013,2012,2011,2010,2009,2008,2007,2006,2005,2004,2003,2002,2001,2000,1999,1998,1997,1996,1995,1994,1993,1992,1991,1990,1989,1988,1987,1986,1985,1984,1983,1982,1979,1975,1972
This statistics in other country:
AfghanistanAlbaniaAlgeriaAndorraAngolaAntigua and BarbudaArab WorldArgentinaArmeniaArubaAustraliaAustriaAzerbaijanBahamas, TheBahrainBangladeshBarbadosBelarusBelgiumBelizeBeninBermudaBhutanBoliviaBosnia and HerzegovinaBotswanaBrazilBritish Virgin IslandsBrunei DarussalamBulgariaBurkina FasoBurundiCabo VerdeCambodiaCameroonCanadaCaribbean small statesCayman IslandsCentral African RepublicCentral Europe and the BalticsChadChileChinaColombiaComorosCongo, Dem. Rep.Congo, Rep.Costa RicaCote d'IvoireCroatiaCubaCuracaoCyprusCzech RepublicDenmarkDjiboutiDominicaDominican RepublicEarly-demographic dividendEast Asia & PacificEast Asia & Pacific (excluding high income)East Asia & Pacific (IDA & IBRD countries)EcuadorEgypt, Arab Rep.El SalvadorEquatorial GuineaEritreaEstoniaEthiopiaEuro areaEurope & Central AsiaEurope & Central Asia (excluding high income)Europe & Central Asia (IDA & IBRD countries)European UnionFijiFinlandFragile and conflict affected situationsFranceGabonGambia, TheGeorgiaGermanyGhanaGibraltarGreeceGrenadaGuatemalaGuineaGuinea-BissauGuyanaHaitiHeavily indebted poor countries (HIPC)High incomeHondurasHong Kong SAR, ChinaHungaryIBRD onlyIcelandIDA & IBRD totalIDA blendIDA onlyIDA totalIndiaIndonesiaIran, Islamic Rep.IraqIrelandIsraelItalyJamaicaJapanJordanKazakhstanKenyaKiribatiKorea, Rep.KuwaitKyrgyz RepublicLao PDRLate-demographic dividendLatin America & Caribbean Latin America & Caribbean (excluding high income)Latin America & the Caribbean (IDA & IBRD countries)LatviaLeast developed countries: UN classificationLebanonLesothoLiberiaLibyaLiechtensteinLithuaniaLow & middle incomeLow incomeLower middle incomeLuxembourgMacao SAR, ChinaMacedonia, FYRMadagascarMalawiMalaysiaMaldivesMaliMaltaMarshall IslandsMauritaniaMauritiusMexicoMiddle East & North AfricaMiddle East & North Africa (excluding high income)Middle East & North Africa (IDA & IBRD countries)Middle incomeMoldovaMonacoMongoliaMoroccoMozambiqueMyanmarNamibiaNauruNepalNetherlandsNew ZealandNicaraguaNigerNigeriaNorth AmericaNorwayOECD membersOmanOther small statesPacific island small statesPakistanPalauPanamaPapua New GuineaParaguayPeruPhilippinesPolandPortugalPost-demographic dividendPre-demographic dividendPuerto RicoQatarRomaniaRussian FederationRwandaSamoaSan MarinoSao Tome and PrincipeSaudi ArabiaSenegalSerbiaSeychellesSierra LeoneSingaporeSlovak RepublicSloveniaSmall statesSolomon IslandsSomaliaSouth AfricaSouth AsiaSouth Asia (IDA & IBRD)SpainSri LankaSt. Kitts and NevisSt. LuciaSt. Vincent and the GrenadinesSub-Saharan Africa Sub-Saharan Africa (excluding high income)Sub-Saharan Africa (IDA & IBRD countries)SudanSurinameSwazilandSwedenSwitzerlandSyrian Arab RepublicTajikistanTanzaniaThailandTimor-LesteTogoTongaTrinidad and TobagoTunisiaTurkeyTurks and Caicos IslandsTuvaluUgandaUkraineUnited Arab EmiratesUnited KingdomUnited StatesUpper middle incomeUruguayVanuatuVenezuela, RBVietnamWest Bank and GazaWorldYemen, Rep.ZambiaZimbabwe Timeline:
This timeline shows a graph from 1972 to 2015 of Indonesia. No data until 1971. Number of actual observations by date: 37.
Source name:
World Development Indicators
Source organization:
UNESCO Institute for Statistics
Categories, topics:
Education
Last updated:
apr 23, 2017
Indicators value changes by year
Maximum:
34.427
jan 1, 1975
At the date of observation
Value
Absolute change
Change from previous value
jan 1, 1972
33.17
+33.17
0.0%
jan 1, 1975
34.427
+1.257
3.79%
jan 1, 1979
23.588
-10.839
-31.48%
jan 1, 1982
20.742
-2.846
-12.07%
jan 1, 1983
19.612
-1.13
-5.45%
jan 1, 1984
19.15
-0.462
-2.36%
jan 1, 1985
18.127
-1.023
-5.34%
jan 1, 1986
17.477
-0.65
-3.58%
jan 1, 1987
17.313
-0.164
-0.94%
jan 1, 1988
17.617
+0.305
1.76%
jan 1, 1989
17.353
-0.265
-1.5%
jan 1, 1990
17.421
+0.068
0.39%
jan 1, 1991
17.483
+0.062
0.36%
jan 1, 1992
17.574
+0.09
0.52%
jan 1, 1993
17.069
-0.504
-2.87%
jan 1, 1994
17.095
+0.026
0.15%
jan 1, 1995
17.767
+0.672
3.93%
jan 1, 1996
17.695
-0.072
-0.41%
jan 1, 1997
17.652
-0.043
-0.25%
jan 1, 1998
17.303
-0.349
-1.98%
jan 1, 1999
17.985
+0.682
3.94%
jan 1, 2000
17.902
-0.083
-0.46%
jan 1, 2001
15.72
-2.182
-12.19%
jan 1, 2002
15.865
+0.145
0.92%
jan 1, 2003
15.971
+0.106
0.67%
jan 1, 2004
16.143
+0.172
1.08%
jan 1, 2005
16.322
+0.18
1.11%
jan 1, 2006
16.647
+0.325
1.99%
jan 1, 2007
15.899
-0.749
-4.5%
jan 1, 2008
18.196
+2.298
14.45%
jan 1, 2009
16.11
-2.086
-11.47%
jan 1, 2010
16.379
+0.269
1.67%
jan 1, 2011
16.817
+0.438
2.67%
jan 1, 2012
17.133
+0.317
1.88%
jan 1, 2013
17.331
+0.197
1.15%
jan 1, 2014
17.945
+0.614
3.54%
jan 1, 2015
18.406
+0.462
2.57%
Ranking of countries by current statistics by years


Comments: