29
/
en
AIzaSyAYiBZKx7MnpbEhh9jyipgxe19OcubqV5w
April 1, 2024
222665
Peru
PER
true
2
1
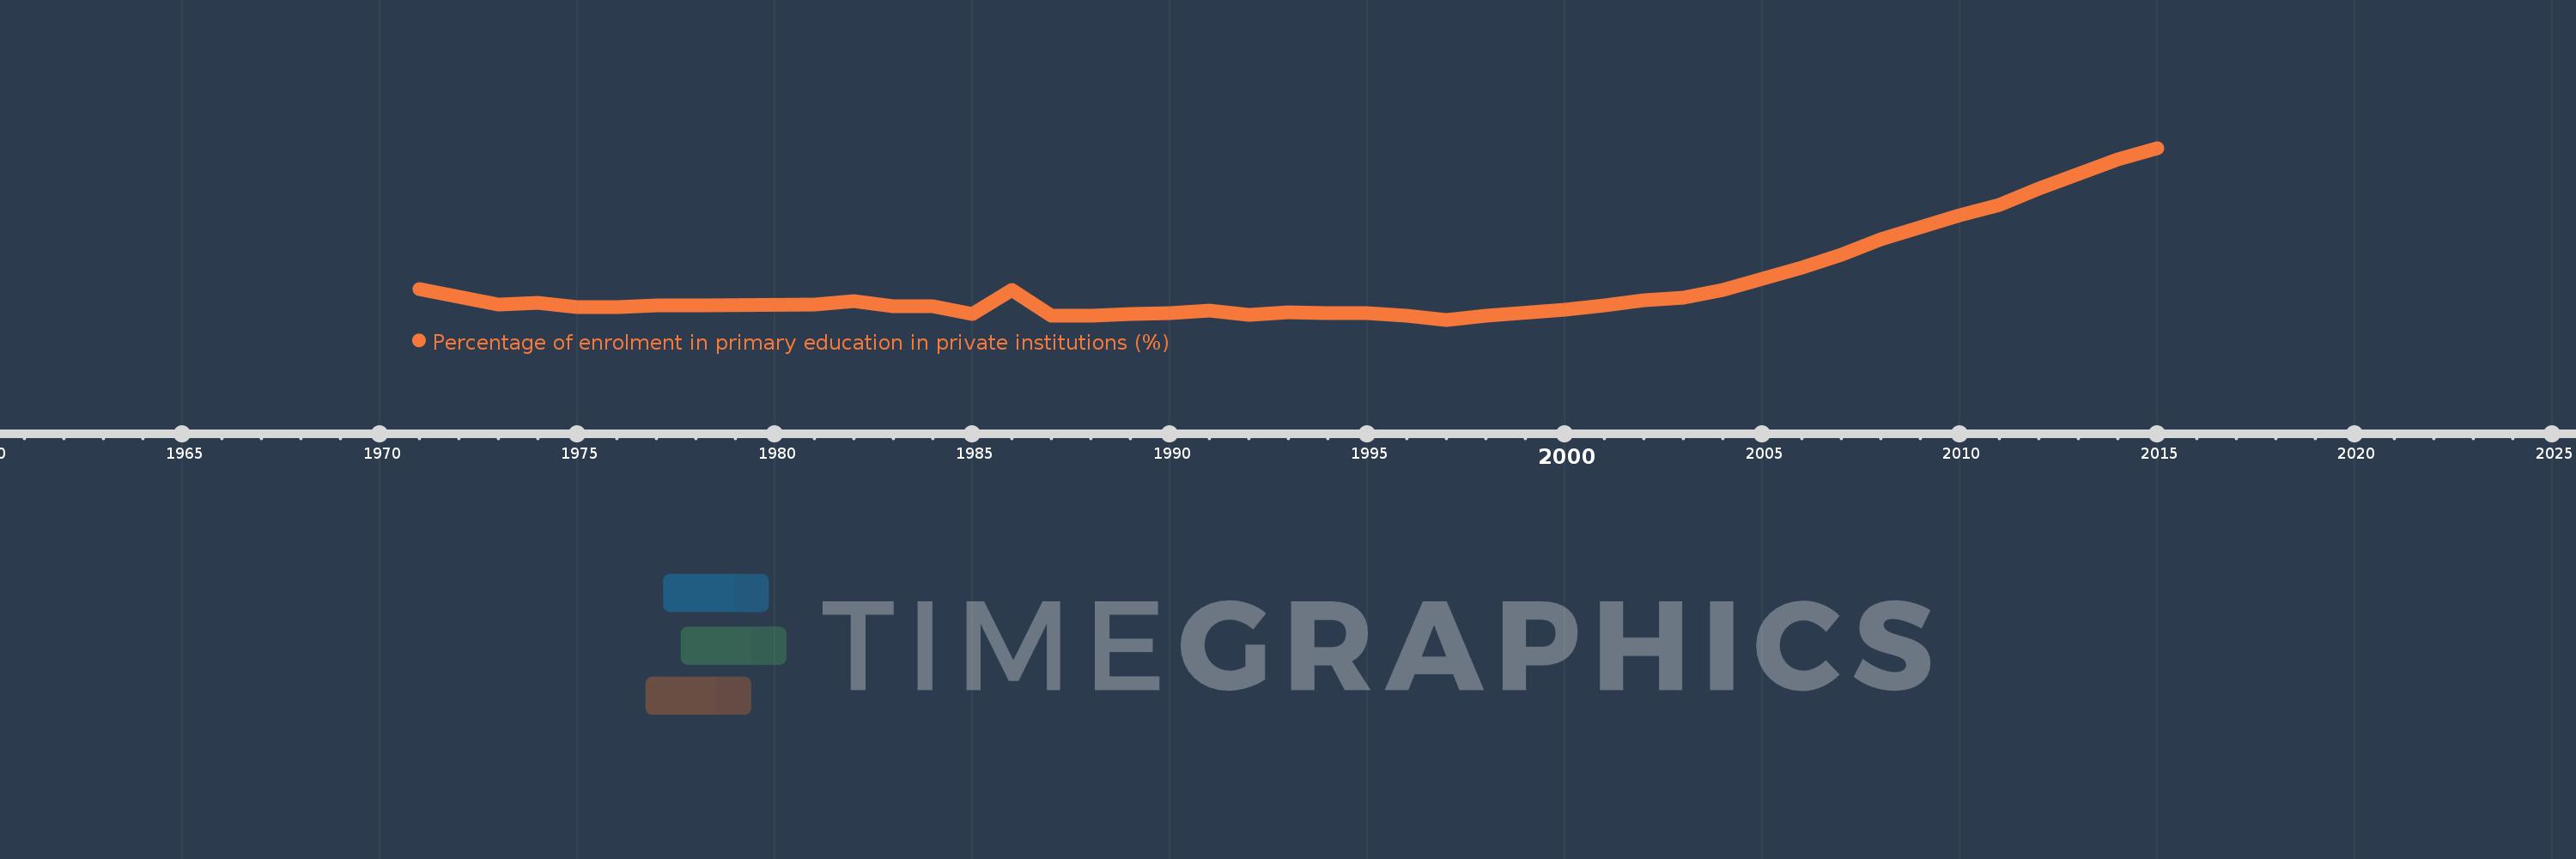
Percentage of enrolment in primary education in private institutions (%)
2015,2014,2012,2011,2010,2009,2008,2007,2006,2004,2003,2002,2001,2000,1998,1997,1996,1995,1994,1993,1992,1991,1990,1989,1988,1987,1986,1985,1984,1983,1982,1981,1978,1977,1976,1975,1974,1973,1972,1971
This statistics in other country:
AfghanistanAlbaniaAlgeriaAndorraAngolaAntigua and BarbudaArab WorldArgentinaArmeniaArubaAustraliaAustriaAzerbaijanBahamas, TheBahrainBangladeshBarbadosBelarusBelgiumBelizeBeninBermudaBhutanBoliviaBosnia and HerzegovinaBotswanaBrazilBritish Virgin IslandsBrunei DarussalamBulgariaBurkina FasoBurundiCabo VerdeCambodiaCameroonCanadaCaribbean small statesCayman IslandsCentral African RepublicCentral Europe and the BalticsChadChileChinaColombiaComorosCongo, Dem. Rep.Congo, Rep.Costa RicaCote d'IvoireCroatiaCubaCuracaoCyprusCzech RepublicDenmarkDjiboutiDominicaDominican RepublicEarly-demographic dividendEast Asia & PacificEast Asia & Pacific (excluding high income)East Asia & Pacific (IDA & IBRD countries)EcuadorEgypt, Arab Rep.El SalvadorEquatorial GuineaEritreaEstoniaEthiopiaEuro areaEurope & Central AsiaEurope & Central Asia (excluding high income)Europe & Central Asia (IDA & IBRD countries)European UnionFijiFinlandFragile and conflict affected situationsFranceGabonGambia, TheGeorgiaGermanyGhanaGibraltarGreeceGrenadaGuatemalaGuineaGuinea-BissauGuyanaHaitiHeavily indebted poor countries (HIPC)High incomeHondurasHong Kong SAR, ChinaHungaryIBRD onlyIcelandIDA & IBRD totalIDA blendIDA onlyIDA totalIndiaIndonesiaIran, Islamic Rep.IraqIrelandIsraelItalyJamaicaJapanJordanKazakhstanKenyaKiribatiKorea, Rep.KuwaitKyrgyz RepublicLao PDRLate-demographic dividendLatin America & Caribbean Latin America & Caribbean (excluding high income)Latin America & the Caribbean (IDA & IBRD countries)LatviaLeast developed countries: UN classificationLebanonLesothoLiberiaLibyaLiechtensteinLithuaniaLow & middle incomeLow incomeLower middle incomeLuxembourgMacao SAR, ChinaMacedonia, FYRMadagascarMalawiMalaysiaMaldivesMaliMaltaMarshall IslandsMauritaniaMauritiusMexicoMiddle East & North AfricaMiddle East & North Africa (excluding high income)Middle East & North Africa (IDA & IBRD countries)Middle incomeMoldovaMonacoMongoliaMoroccoMozambiqueMyanmarNamibiaNauruNepalNetherlandsNew ZealandNicaraguaNigerNigeriaNorth AmericaNorwayOECD membersOmanOther small statesPacific island small statesPakistanPalauPanamaPapua New GuineaParaguayPeruPhilippinesPolandPortugalPost-demographic dividendPre-demographic dividendPuerto RicoQatarRomaniaRussian FederationRwandaSamoaSan MarinoSao Tome and PrincipeSaudi ArabiaSenegalSerbiaSeychellesSierra LeoneSingaporeSlovak RepublicSloveniaSmall statesSolomon IslandsSomaliaSouth AfricaSouth AsiaSouth Asia (IDA & IBRD)SpainSri LankaSt. Kitts and NevisSt. LuciaSt. Vincent and the GrenadinesSub-Saharan Africa Sub-Saharan Africa (excluding high income)Sub-Saharan Africa (IDA & IBRD countries)SudanSurinameSwazilandSwedenSwitzerlandSyrian Arab RepublicTajikistanTanzaniaThailandTimor-LesteTogoTongaTrinidad and TobagoTunisiaTurkeyTurks and Caicos IslandsTuvaluUgandaUkraineUnited Arab EmiratesUnited KingdomUnited StatesUpper middle incomeUruguayVanuatuVenezuela, RBVietnamWest Bank and GazaWorldYemen, Rep.ZambiaZimbabwe Timeline:
This timeline shows a graph from 1971 to 2015 of Peru. No data until 1970. Number of actual observations by date: 40.
Source name:
World Development Indicators
Source organization:
UNESCO Institute for Statistics
Categories, topics:
Education
Last updated:
apr 23, 2017
Indicators value changes by year
Minimum:
11.734
jan 1, 1997
Maximum:
27.169
jan 1, 2015
At the date of observation
Value
Absolute change
Change from previous value
jan 1, 1971
14.502
+14.502
0.0%
jan 1, 1972
13.759
-0.743
-5.12%
jan 1, 1973
13.1
-0.659
-4.79%
jan 1, 1974
13.228
+0.129
0.98%
jan 1, 1975
12.834
-0.394
-2.98%
jan 1, 1976
12.906
+0.072
0.56%
jan 1, 1977
12.999
+0.094
0.73%
jan 1, 1978
13.029
+0.03
0.23%
jan 1, 1981
13.126
+0.097
0.74%
jan 1, 1982
13.371
+0.245
1.86%
jan 1, 1983
12.913
-0.457
-3.42%
jan 1, 1984
12.909
-0.004
-0.03%
jan 1, 1985
12.272
-0.637
-4.93%
jan 1, 1986
14.388
+2.116
17.24%
jan 1, 1987
12.117
-2.27
-15.78%
jan 1, 1988
12.082
-0.036
-0.29%
jan 1, 1989
12.228
+0.146
1.21%
jan 1, 1990
12.355
+0.127
1.04%
jan 1, 1991
12.569
+0.214
1.73%
jan 1, 1992
12.19
-0.379
-3.01%
jan 1, 1993
12.386
+0.196
1.61%
jan 1, 1994
12.323
-0.063
-0.51%
jan 1, 1995
12.327
+0.004
0.03%
jan 1, 1996
12.078
-0.25
-2.02%
jan 1, 1997
11.734
-0.343
-2.84%
jan 1, 1998
12.062
+0.328
2.79%
jan 1, 2000
12.644
+0.582
4.82%
jan 1, 2001
13.008
+0.365
2.88%
jan 1, 2002
13.473
+0.465
3.58%
jan 1, 2003
13.741
+0.268
1.99%
jan 1, 2004
14.391
+0.65
4.73%
jan 1, 2006
16.4
+2.008
13.95%
jan 1, 2007
17.556
+1.157
7.05%
jan 1, 2008
18.96
+1.403
7.99%
jan 1, 2009
20.08
+1.12
5.91%
jan 1, 2010
21.092
+1.012
5.04%
jan 1, 2011
22.065
+0.973
4.61%
jan 1, 2012
23.526
+1.461
6.62%
jan 1, 2014
26.126
+2.6
11.05%
jan 1, 2015
27.169
+1.043
3.99%
Ranking of countries by current statistics by years


Comments: