30
/
AIzaSyAYiBZKx7MnpbEhh9jyipgxe19OcubqV5w
April 1, 2024
130930
Ethiopia
ETH
true
2
1
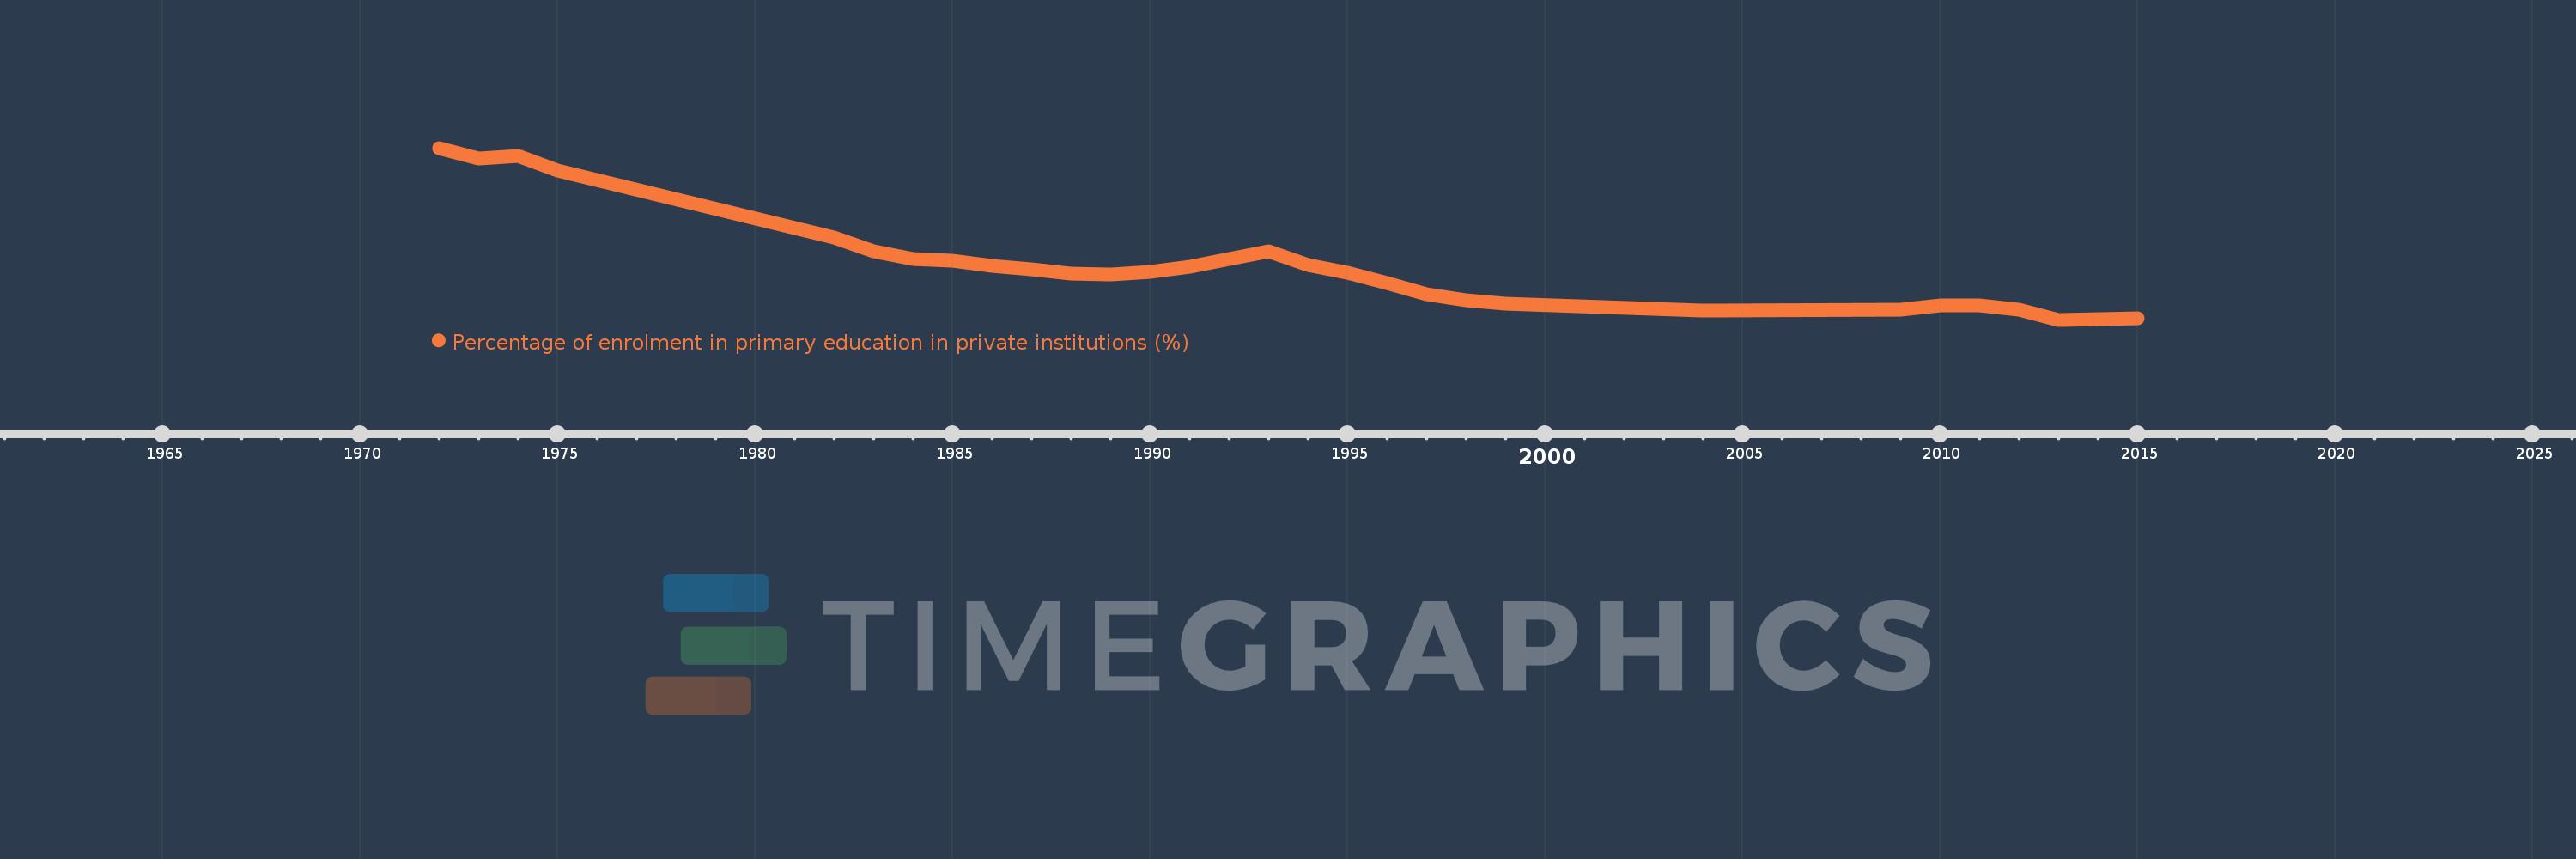
Percentage of enrolment in primary education in private institutions (%)
2015,2013,2012,2011,2010,2009,2004,1999,1998,1997,1996,1995,1994,1993,1992,1991,1990,1989,1988,1987,1986,1985,1984,1983,1982,1975,1974,1973,1972
