29
/
en
AIzaSyAYiBZKx7MnpbEhh9jyipgxe19OcubqV5w
April 1, 2024
32951
Europe & Central Asia (IDA & IBRD countries)
TEC
false
2
1
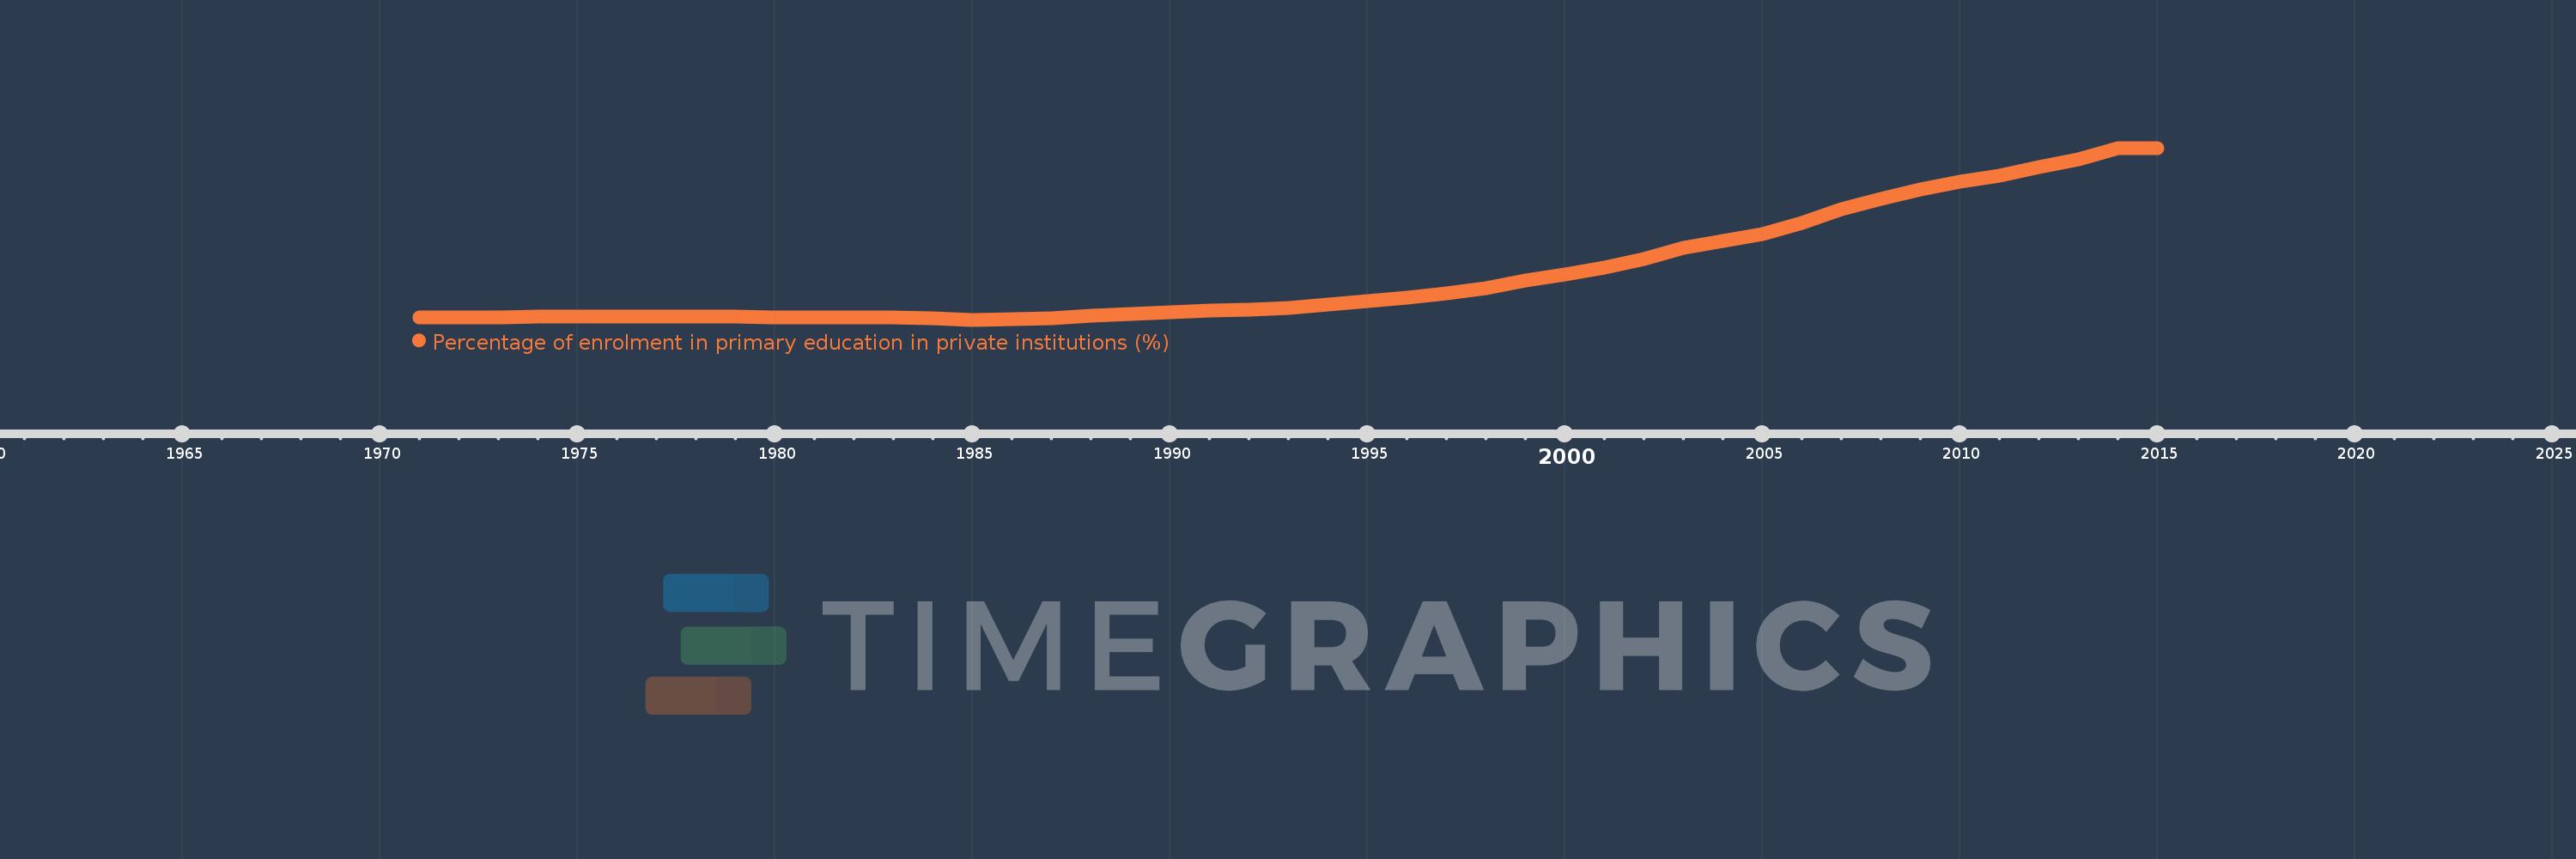
Percentage of enrolment in primary education in private institutions (%)
2015,2014,2013,2012,2011,2010,2009,2008,2007,2006,2005,2004,2003,2002,2001,2000,1999,1998,1997,1996,1995,1994,1993,1992,1991,1990,1989,1988,1987,1986,1985,1984,1983,1982,1981,1980,1979,1978,1977,1976,1975,1974,1973,1972,1971
This statistics in other country:
AfghanistanAlbaniaAlgeriaAndorraAngolaAntigua and BarbudaArab WorldArgentinaArmeniaArubaAustraliaAustriaAzerbaijanBahamas, TheBahrainBangladeshBarbadosBelarusBelgiumBelizeBeninBermudaBhutanBoliviaBosnia and HerzegovinaBotswanaBrazilBritish Virgin IslandsBrunei DarussalamBulgariaBurkina FasoBurundiCabo VerdeCambodiaCameroonCanadaCaribbean small statesCayman IslandsCentral African RepublicCentral Europe and the BalticsChadChileChinaColombiaComorosCongo, Dem. Rep.Congo, Rep.Costa RicaCote d'IvoireCroatiaCubaCuracaoCyprusCzech RepublicDenmarkDjiboutiDominicaDominican RepublicEarly-demographic dividendEast Asia & PacificEast Asia & Pacific (excluding high income)East Asia & Pacific (IDA & IBRD countries)EcuadorEgypt, Arab Rep.El SalvadorEquatorial GuineaEritreaEstoniaEthiopiaEuro areaEurope & Central AsiaEurope & Central Asia (excluding high income)Europe & Central Asia (IDA & IBRD countries)European UnionFijiFinlandFragile and conflict affected situationsFranceGabonGambia, TheGeorgiaGermanyGhanaGibraltarGreeceGrenadaGuatemalaGuineaGuinea-BissauGuyanaHaitiHeavily indebted poor countries (HIPC)High incomeHondurasHong Kong SAR, ChinaHungaryIBRD onlyIcelandIDA & IBRD totalIDA blendIDA onlyIDA totalIndiaIndonesiaIran, Islamic Rep.IraqIrelandIsraelItalyJamaicaJapanJordanKazakhstanKenyaKiribatiKorea, Rep.KuwaitKyrgyz RepublicLao PDRLate-demographic dividendLatin America & Caribbean Latin America & Caribbean (excluding high income)Latin America & the Caribbean (IDA & IBRD countries)LatviaLeast developed countries: UN classificationLebanonLesothoLiberiaLibyaLiechtensteinLithuaniaLow & middle incomeLow incomeLower middle incomeLuxembourgMacao SAR, ChinaMacedonia, FYRMadagascarMalawiMalaysiaMaldivesMaliMaltaMarshall IslandsMauritaniaMauritiusMexicoMiddle East & North AfricaMiddle East & North Africa (excluding high income)Middle East & North Africa (IDA & IBRD countries)Middle incomeMoldovaMonacoMongoliaMoroccoMozambiqueMyanmarNamibiaNauruNepalNetherlandsNew ZealandNicaraguaNigerNigeriaNorth AmericaNorwayOECD membersOmanOther small statesPacific island small statesPakistanPalauPanamaPapua New GuineaParaguayPeruPhilippinesPolandPortugalPost-demographic dividendPre-demographic dividendPuerto RicoQatarRomaniaRussian FederationRwandaSamoaSan MarinoSao Tome and PrincipeSaudi ArabiaSenegalSerbiaSeychellesSierra LeoneSingaporeSlovak RepublicSloveniaSmall statesSolomon IslandsSomaliaSouth AfricaSouth AsiaSouth Asia (IDA & IBRD)SpainSri LankaSt. Kitts and NevisSt. LuciaSt. Vincent and the GrenadinesSub-Saharan Africa Sub-Saharan Africa (excluding high income)Sub-Saharan Africa (IDA & IBRD countries)SudanSurinameSwazilandSwedenSwitzerlandSyrian Arab RepublicTajikistanTanzaniaThailandTimor-LesteTogoTongaTrinidad and TobagoTunisiaTurkeyTurks and Caicos IslandsTuvaluUgandaUkraineUnited Arab EmiratesUnited KingdomUnited StatesUpper middle incomeUruguayVanuatuVenezuela, RBVietnamWest Bank and GazaWorldYemen, Rep.ZambiaZimbabwe Timeline:
This timeline shows a graph from 1971 to 2015 of Europe & Central Asia (IDA & IBRD countries). No data until 1970. Number of actual observations by date: 45.
Source name:
World Development Indicators
Source organization:
UNESCO Institute for Statistics
Categories, topics:
Education
Last updated:
apr 23, 2017
Indicators value changes by year
At the date of observation
Value
Absolute change
Change from previous value
jan 1, 1971
0.113
+0.113
0.0%
jan 1, 1972
0.116
+0.003
2.75%
jan 1, 1973
0.116
+0.0
0.02%
jan 1, 1974
0.119
+0.003
2.77%
jan 1, 1975
0.123
+0.003
2.87%
jan 1, 1976
0.123
+0.0
0.33%
jan 1, 1977
0.123
0.0
-0.13%
jan 1, 1978
0.122
-0.001
-0.97%
jan 1, 1979
0.119
-0.003
-2.55%
jan 1, 1980
0.117
-0.002
-1.48%
jan 1, 1981
0.114
-0.003
-2.45%
jan 1, 1982
0.112
-0.002
-2.1%
jan 1, 1983
0.11
-0.002
-1.6%
jan 1, 1984
0.104
-0.006
-5.39%
jan 1, 1985
0.092
-0.012
-11.26%
jan 1, 1986
0.095
+0.003
3.4%
jan 1, 1987
0.109
+0.014
14.28%
jan 1, 1988
0.129
+0.02
18.53%
jan 1, 1989
0.146
+0.017
13.16%
jan 1, 1990
0.159
+0.013
8.59%
jan 1, 1991
0.178
+0.019
12.05%
jan 1, 1992
0.187
+0.009
5.33%
jan 1, 1993
0.196
+0.008
4.39%
jan 1, 1994
0.23
+0.035
17.72%
jan 1, 1995
0.259
+0.029
12.53%
jan 1, 1996
0.292
+0.033
12.84%
jan 1, 1997
0.333
+0.041
13.91%
jan 1, 1998
0.38
+0.047
14.14%
jan 1, 1999
0.446
+0.066
17.44%
jan 1, 2000
0.502
+0.056
12.48%
jan 1, 2001
0.569
+0.067
13.28%
jan 1, 2002
0.646
+0.078
13.67%
jan 1, 2003
0.744
+0.098
15.11%
jan 1, 2004
0.806
+0.062
8.28%
jan 1, 2005
0.869
+0.064
7.91%
jan 1, 2006
0.975
+0.105
12.1%
jan 1, 2007
1.098
+0.123
12.66%
jan 1, 2008
1.194
+0.096
8.77%
jan 1, 2009
1.281
+0.086
7.24%
jan 1, 2010
1.348
+0.067
5.24%
jan 1, 2011
1.404
+0.056
4.16%
jan 1, 2012
1.484
+0.08
5.7%
jan 1, 2013
1.549
+0.065
4.4%
jan 1, 2014
1.656
+0.107
6.88%
jan 1, 2015
1.655
-0.001
-0.07%
Ranking of countries by current statistics by years


Comments: