29
/
en
AIzaSyAYiBZKx7MnpbEhh9jyipgxe19OcubqV5w
April 1, 2024
38467
IDA blend
IDB
false
2
1
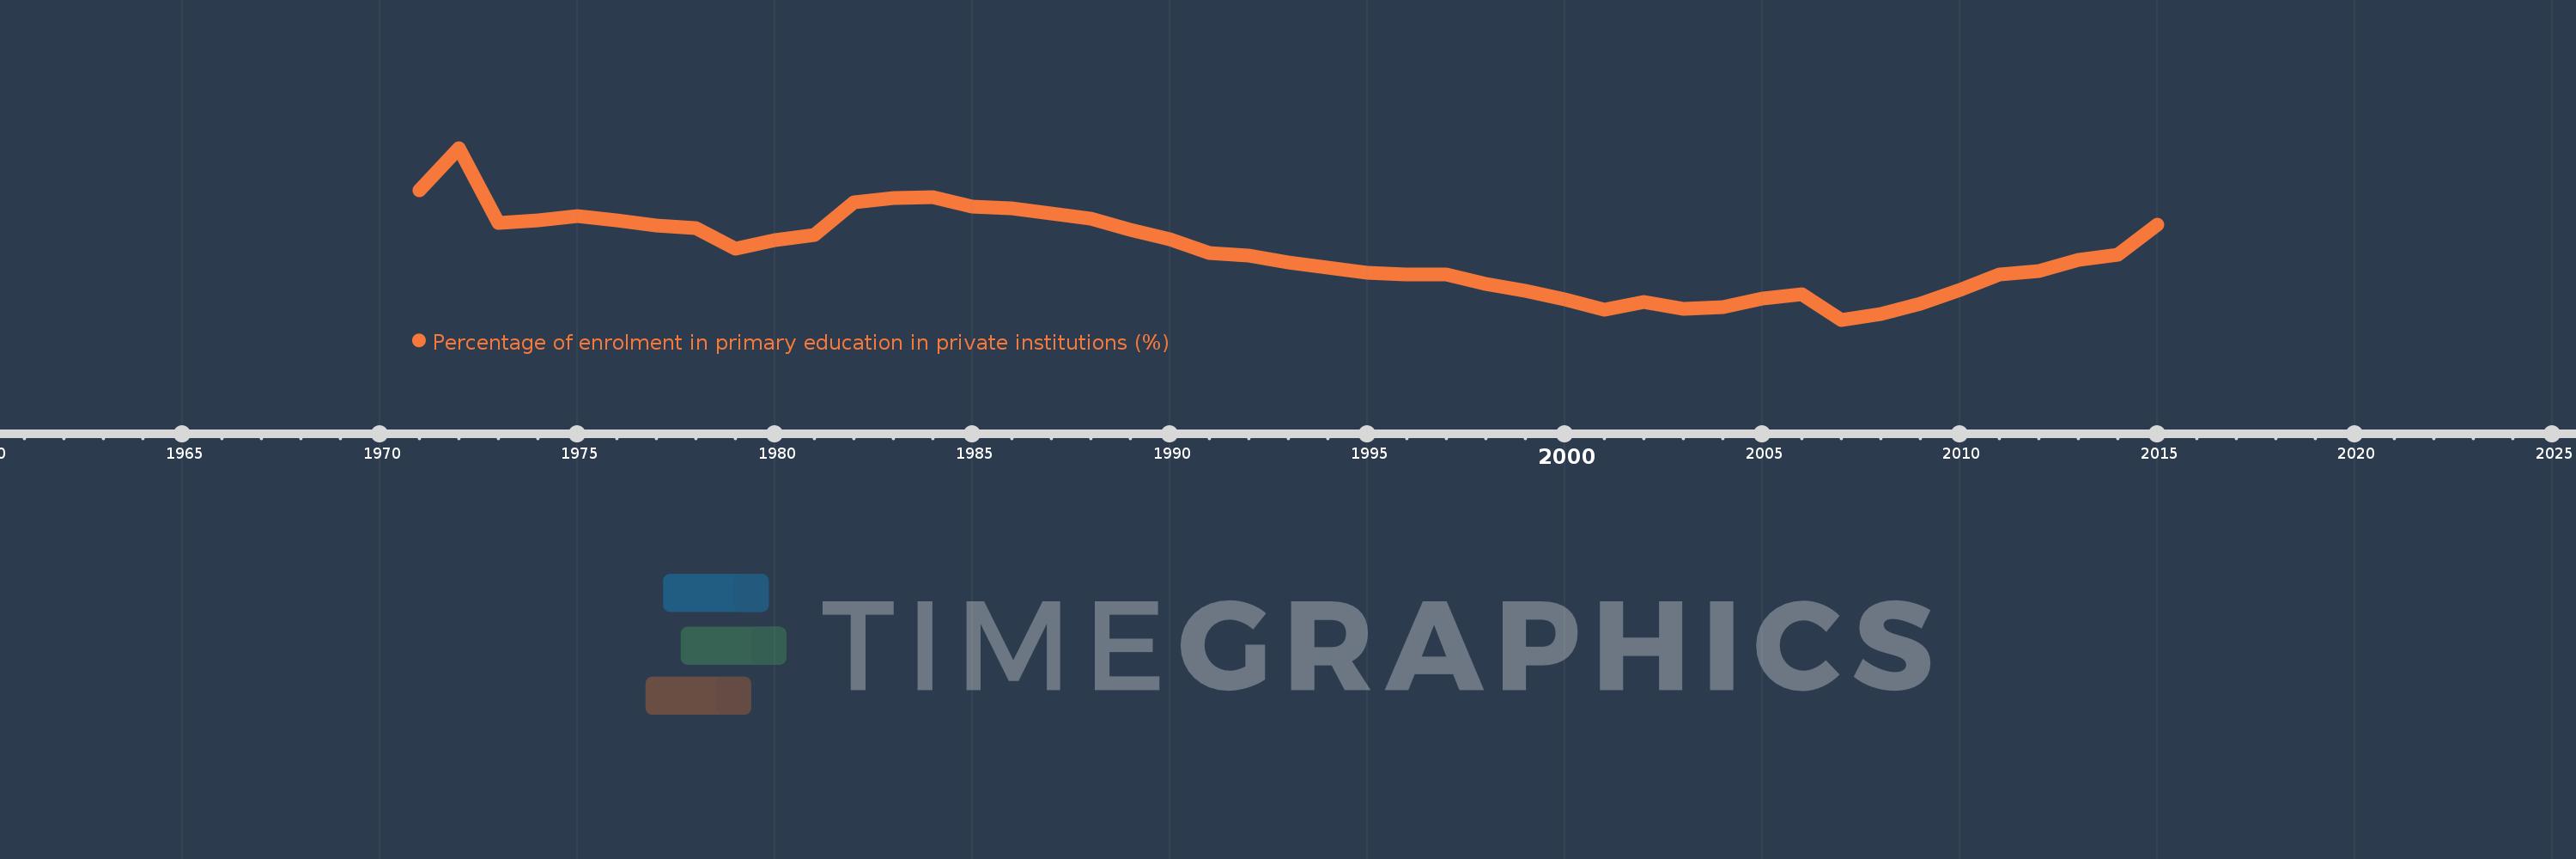
Percentage of enrolment in primary education in private institutions (%)
2015,2014,2013,2012,2011,2010,2009,2008,2007,2006,2005,2004,2003,2002,2001,2000,1999,1998,1997,1996,1995,1994,1993,1992,1991,1990,1989,1988,1987,1986,1985,1984,1983,1982,1981,1980,1979,1978,1977,1976,1975,1974,1973,1972,1971
This statistics in other country:
AfghanistanAlbaniaAlgeriaAndorraAngolaAntigua and BarbudaArab WorldArgentinaArmeniaArubaAustraliaAustriaAzerbaijanBahamas, TheBahrainBangladeshBarbadosBelarusBelgiumBelizeBeninBermudaBhutanBoliviaBosnia and HerzegovinaBotswanaBrazilBritish Virgin IslandsBrunei DarussalamBulgariaBurkina FasoBurundiCabo VerdeCambodiaCameroonCanadaCaribbean small statesCayman IslandsCentral African RepublicCentral Europe and the BalticsChadChileChinaColombiaComorosCongo, Dem. Rep.Congo, Rep.Costa RicaCote d'IvoireCroatiaCubaCuracaoCyprusCzech RepublicDenmarkDjiboutiDominicaDominican RepublicEarly-demographic dividendEast Asia & PacificEast Asia & Pacific (excluding high income)East Asia & Pacific (IDA & IBRD countries)EcuadorEgypt, Arab Rep.El SalvadorEquatorial GuineaEritreaEstoniaEthiopiaEuro areaEurope & Central AsiaEurope & Central Asia (excluding high income)Europe & Central Asia (IDA & IBRD countries)European UnionFijiFinlandFragile and conflict affected situationsFranceGabonGambia, TheGeorgiaGermanyGhanaGibraltarGreeceGrenadaGuatemalaGuineaGuinea-BissauGuyanaHaitiHeavily indebted poor countries (HIPC)High incomeHondurasHong Kong SAR, ChinaHungaryIBRD onlyIcelandIDA & IBRD totalIDA blendIDA onlyIDA totalIndiaIndonesiaIran, Islamic Rep.IraqIrelandIsraelItalyJamaicaJapanJordanKazakhstanKenyaKiribatiKorea, Rep.KuwaitKyrgyz RepublicLao PDRLate-demographic dividendLatin America & Caribbean Latin America & Caribbean (excluding high income)Latin America & the Caribbean (IDA & IBRD countries)LatviaLeast developed countries: UN classificationLebanonLesothoLiberiaLibyaLiechtensteinLithuaniaLow & middle incomeLow incomeLower middle incomeLuxembourgMacao SAR, ChinaMacedonia, FYRMadagascarMalawiMalaysiaMaldivesMaliMaltaMarshall IslandsMauritaniaMauritiusMexicoMiddle East & North AfricaMiddle East & North Africa (excluding high income)Middle East & North Africa (IDA & IBRD countries)Middle incomeMoldovaMonacoMongoliaMoroccoMozambiqueMyanmarNamibiaNauruNepalNetherlandsNew ZealandNicaraguaNigerNigeriaNorth AmericaNorwayOECD membersOmanOther small statesPacific island small statesPakistanPalauPanamaPapua New GuineaParaguayPeruPhilippinesPolandPortugalPost-demographic dividendPre-demographic dividendPuerto RicoQatarRomaniaRussian FederationRwandaSamoaSan MarinoSao Tome and PrincipeSaudi ArabiaSenegalSerbiaSeychellesSierra LeoneSingaporeSlovak RepublicSloveniaSmall statesSolomon IslandsSomaliaSouth AfricaSouth AsiaSouth Asia (IDA & IBRD)SpainSri LankaSt. Kitts and NevisSt. LuciaSt. Vincent and the GrenadinesSub-Saharan Africa Sub-Saharan Africa (excluding high income)Sub-Saharan Africa (IDA & IBRD countries)SudanSurinameSwazilandSwedenSwitzerlandSyrian Arab RepublicTajikistanTanzaniaThailandTimor-LesteTogoTongaTrinidad and TobagoTunisiaTurkeyTurks and Caicos IslandsTuvaluUgandaUkraineUnited Arab EmiratesUnited KingdomUnited StatesUpper middle incomeUruguayVanuatuVenezuela, RBVietnamWest Bank and GazaWorldYemen, Rep.ZambiaZimbabwe Timeline:
This timeline shows a graph from 1971 to 2015 of IDA blend. No data until 1970. Number of actual observations by date: 45.
Source name:
World Development Indicators
Source organization:
UNESCO Institute for Statistics
Categories, topics:
Education
Last updated:
apr 23, 2017
Indicators value changes by year
Minimum:
16.778
jan 1, 2007
Maximum:
22.122
jan 1, 1972
At the date of observation
Value
Absolute change
Change from previous value
jan 1, 1971
20.795
+20.795
0.0%
jan 1, 1972
22.122
+1.328
6.38%
jan 1, 1973
19.776
-2.346
-10.61%
jan 1, 1974
19.876
+0.1
0.51%
jan 1, 1975
19.993
+0.117
0.59%
jan 1, 1976
19.861
-0.132
-0.66%
jan 1, 1977
19.722
-0.138
-0.7%
jan 1, 1978
19.635
-0.088
-0.44%
jan 1, 1979
18.978
-0.657
-3.35%
jan 1, 1980
19.252
+0.275
1.45%
jan 1, 1981
19.415
+0.163
0.85%
jan 1, 1982
20.435
+1.02
5.26%
jan 1, 1983
20.559
+0.124
0.6%
jan 1, 1984
20.581
+0.022
0.11%
jan 1, 1985
20.304
-0.277
-1.35%
jan 1, 1986
20.239
-0.066
-0.32%
jan 1, 1987
20.081
-0.157
-0.78%
jan 1, 1988
19.917
-0.164
-0.82%
jan 1, 1989
19.576
-0.341
-1.71%
jan 1, 1990
19.284
-0.293
-1.5%
jan 1, 1991
18.849
-0.435
-2.26%
jan 1, 1992
18.772
-0.077
-0.41%
jan 1, 1993
18.571
-0.201
-1.07%
jan 1, 1994
18.402
-0.17
-0.91%
jan 1, 1995
18.244
-0.158
-0.86%
jan 1, 1996
18.182
-0.062
-0.34%
jan 1, 1997
18.19
+0.008
0.04%
jan 1, 1998
17.903
-0.286
-1.57%
jan 1, 1999
17.691
-0.212
-1.18%
jan 1, 2000
17.424
-0.267
-1.51%
jan 1, 2001
17.088
-0.336
-1.93%
jan 1, 2002
17.341
+0.253
1.48%
jan 1, 2003
17.13
-0.211
-1.22%
jan 1, 2004
17.184
+0.054
0.31%
jan 1, 2005
17.432
+0.247
1.44%
jan 1, 2006
17.574
+0.142
0.82%
jan 1, 2007
16.778
-0.796
-4.53%
jan 1, 2008
16.946
+0.169
1.01%
jan 1, 2009
17.273
+0.327
1.93%
jan 1, 2010
17.701
+0.427
2.47%
jan 1, 2011
18.177
+0.477
2.69%
jan 1, 2012
18.294
+0.117
0.64%
jan 1, 2013
18.643
+0.349
1.91%
jan 1, 2014
18.793
+0.149
0.8%
jan 1, 2015
19.731
+0.938
4.99%
Ranking of countries by current statistics by years


Comments: