29
/
en
AIzaSyAYiBZKx7MnpbEhh9jyipgxe19OcubqV5w
April 1, 2024
123951
Ecuador
ECU
true
2
1
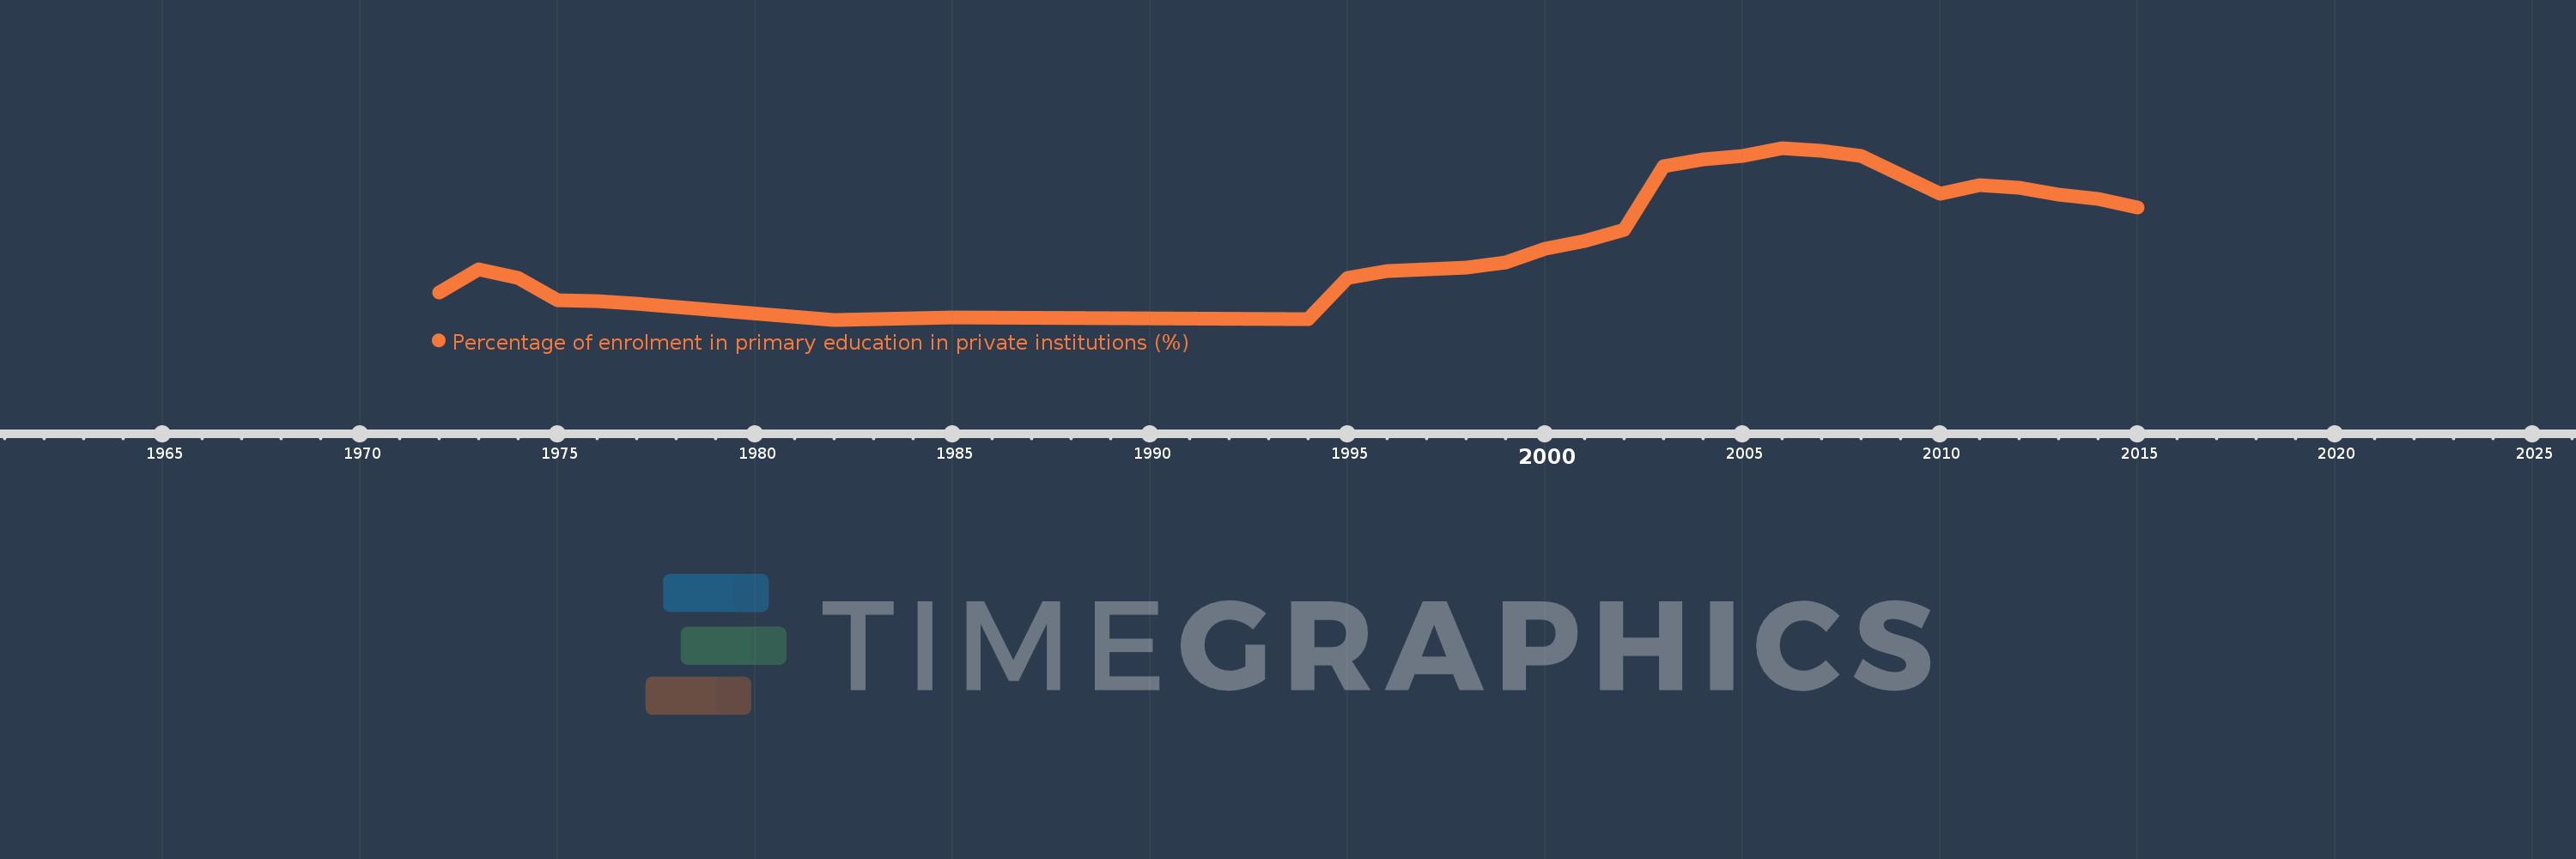
Percentage of enrolment in primary education in private institutions (%)
2015,2014,2013,2012,2011,2010,2008,2007,2006,2005,2004,2003,2002,2001,2000,1999,1998,1997,1996,1995,1994,1985,1982,1977,1976,1975,1974,1973,1972
This statistics in other country:
AfghanistanAlbaniaAlgeriaAndorraAngolaAntigua and BarbudaArab WorldArgentinaArmeniaArubaAustraliaAustriaAzerbaijanBahamas, TheBahrainBangladeshBarbadosBelarusBelgiumBelizeBeninBermudaBhutanBoliviaBosnia and HerzegovinaBotswanaBrazilBritish Virgin IslandsBrunei DarussalamBulgariaBurkina FasoBurundiCabo VerdeCambodiaCameroonCanadaCaribbean small statesCayman IslandsCentral African RepublicCentral Europe and the BalticsChadChileChinaColombiaComorosCongo, Dem. Rep.Congo, Rep.Costa RicaCote d'IvoireCroatiaCubaCuracaoCyprusCzech RepublicDenmarkDjiboutiDominicaDominican RepublicEarly-demographic dividendEast Asia & PacificEast Asia & Pacific (excluding high income)East Asia & Pacific (IDA & IBRD countries)EcuadorEgypt, Arab Rep.El SalvadorEquatorial GuineaEritreaEstoniaEthiopiaEuro areaEurope & Central AsiaEurope & Central Asia (excluding high income)Europe & Central Asia (IDA & IBRD countries)European UnionFijiFinlandFragile and conflict affected situationsFranceGabonGambia, TheGeorgiaGermanyGhanaGibraltarGreeceGrenadaGuatemalaGuineaGuinea-BissauGuyanaHaitiHeavily indebted poor countries (HIPC)High incomeHondurasHong Kong SAR, ChinaHungaryIBRD onlyIcelandIDA & IBRD totalIDA blendIDA onlyIDA totalIndiaIndonesiaIran, Islamic Rep.IraqIrelandIsraelItalyJamaicaJapanJordanKazakhstanKenyaKiribatiKorea, Rep.KuwaitKyrgyz RepublicLao PDRLate-demographic dividendLatin America & Caribbean Latin America & Caribbean (excluding high income)Latin America & the Caribbean (IDA & IBRD countries)LatviaLeast developed countries: UN classificationLebanonLesothoLiberiaLibyaLiechtensteinLithuaniaLow & middle incomeLow incomeLower middle incomeLuxembourgMacao SAR, ChinaMacedonia, FYRMadagascarMalawiMalaysiaMaldivesMaliMaltaMarshall IslandsMauritaniaMauritiusMexicoMiddle East & North AfricaMiddle East & North Africa (excluding high income)Middle East & North Africa (IDA & IBRD countries)Middle incomeMoldovaMonacoMongoliaMoroccoMozambiqueMyanmarNamibiaNauruNepalNetherlandsNew ZealandNicaraguaNigerNigeriaNorth AmericaNorwayOECD membersOmanOther small statesPacific island small statesPakistanPalauPanamaPapua New GuineaParaguayPeruPhilippinesPolandPortugalPost-demographic dividendPre-demographic dividendPuerto RicoQatarRomaniaRussian FederationRwandaSamoaSan MarinoSao Tome and PrincipeSaudi ArabiaSenegalSerbiaSeychellesSierra LeoneSingaporeSlovak RepublicSloveniaSmall statesSolomon IslandsSomaliaSouth AfricaSouth AsiaSouth Asia (IDA & IBRD)SpainSri LankaSt. Kitts and NevisSt. LuciaSt. Vincent and the GrenadinesSub-Saharan Africa Sub-Saharan Africa (excluding high income)Sub-Saharan Africa (IDA & IBRD countries)SudanSurinameSwazilandSwedenSwitzerlandSyrian Arab RepublicTajikistanTanzaniaThailandTimor-LesteTogoTongaTrinidad and TobagoTunisiaTurkeyTurks and Caicos IslandsTuvaluUgandaUkraineUnited Arab EmiratesUnited KingdomUnited StatesUpper middle incomeUruguayVanuatuVenezuela, RBVietnamWest Bank and GazaWorldYemen, Rep.ZambiaZimbabwe Timeline:
This timeline shows a graph from 1972 to 2015 of Ecuador. No data until 1971. Number of actual observations by date: 29.
Source name:
World Development Indicators
Source organization:
UNESCO Institute for Statistics
Categories, topics:
Education
Last updated:
apr 23, 2017
Indicators value changes by year
Minimum:
15.901
jan 1, 1982
Maximum:
28.785
jan 1, 2006
At the date of observation
Value
Absolute change
Change from previous value
jan 1, 1972
17.938
+17.938
0.0%
jan 1, 1973
19.7
+1.762
9.82%
jan 1, 1974
19.03
-0.67
-3.4%
jan 1, 1975
17.378
-1.652
-8.68%
jan 1, 1976
17.313
-0.065
-0.38%
jan 1, 1977
17.105
-0.208
-1.2%
jan 1, 1982
15.901
-1.204
-7.04%
jan 1, 1985
16.065
+0.164
1.03%
jan 1, 1994
15.939
-0.126
-0.78%
jan 1, 1995
19.062
+3.122
19.59%
jan 1, 1996
19.533
+0.471
2.47%
jan 1, 1997
19.661
+0.129
0.66%
jan 1, 1998
19.815
+0.154
0.78%
jan 1, 1999
20.221
+0.406
2.05%
jan 1, 2000
21.234
+1.013
5.01%
jan 1, 2001
21.795
+0.562
2.64%
jan 1, 2002
22.668
+0.873
4.0%
jan 1, 2003
27.403
+4.735
20.89%
jan 1, 2004
27.918
+0.514
1.88%
jan 1, 2005
28.157
+0.239
0.86%
jan 1, 2006
28.785
+0.629
2.23%
jan 1, 2007
28.551
-0.234
-0.81%
jan 1, 2008
28.168
-0.383
-1.34%
jan 1, 2010
25.376
-2.792
-9.91%
jan 1, 2011
26.019
+0.643
2.53%
jan 1, 2012
25.775
-0.244
-0.94%
jan 1, 2013
25.279
-0.496
-1.92%
jan 1, 2014
24.946
-0.333
-1.32%
jan 1, 2015
24.32
-0.626
-2.51%
Ranking of countries by current statistics by years


Comments: