29
/
en
AIzaSyAYiBZKx7MnpbEhh9jyipgxe19OcubqV5w
April 1, 2024
43767
Latin America & the Caribbean (IDA & IBRD countries)
TLA
false
2
1
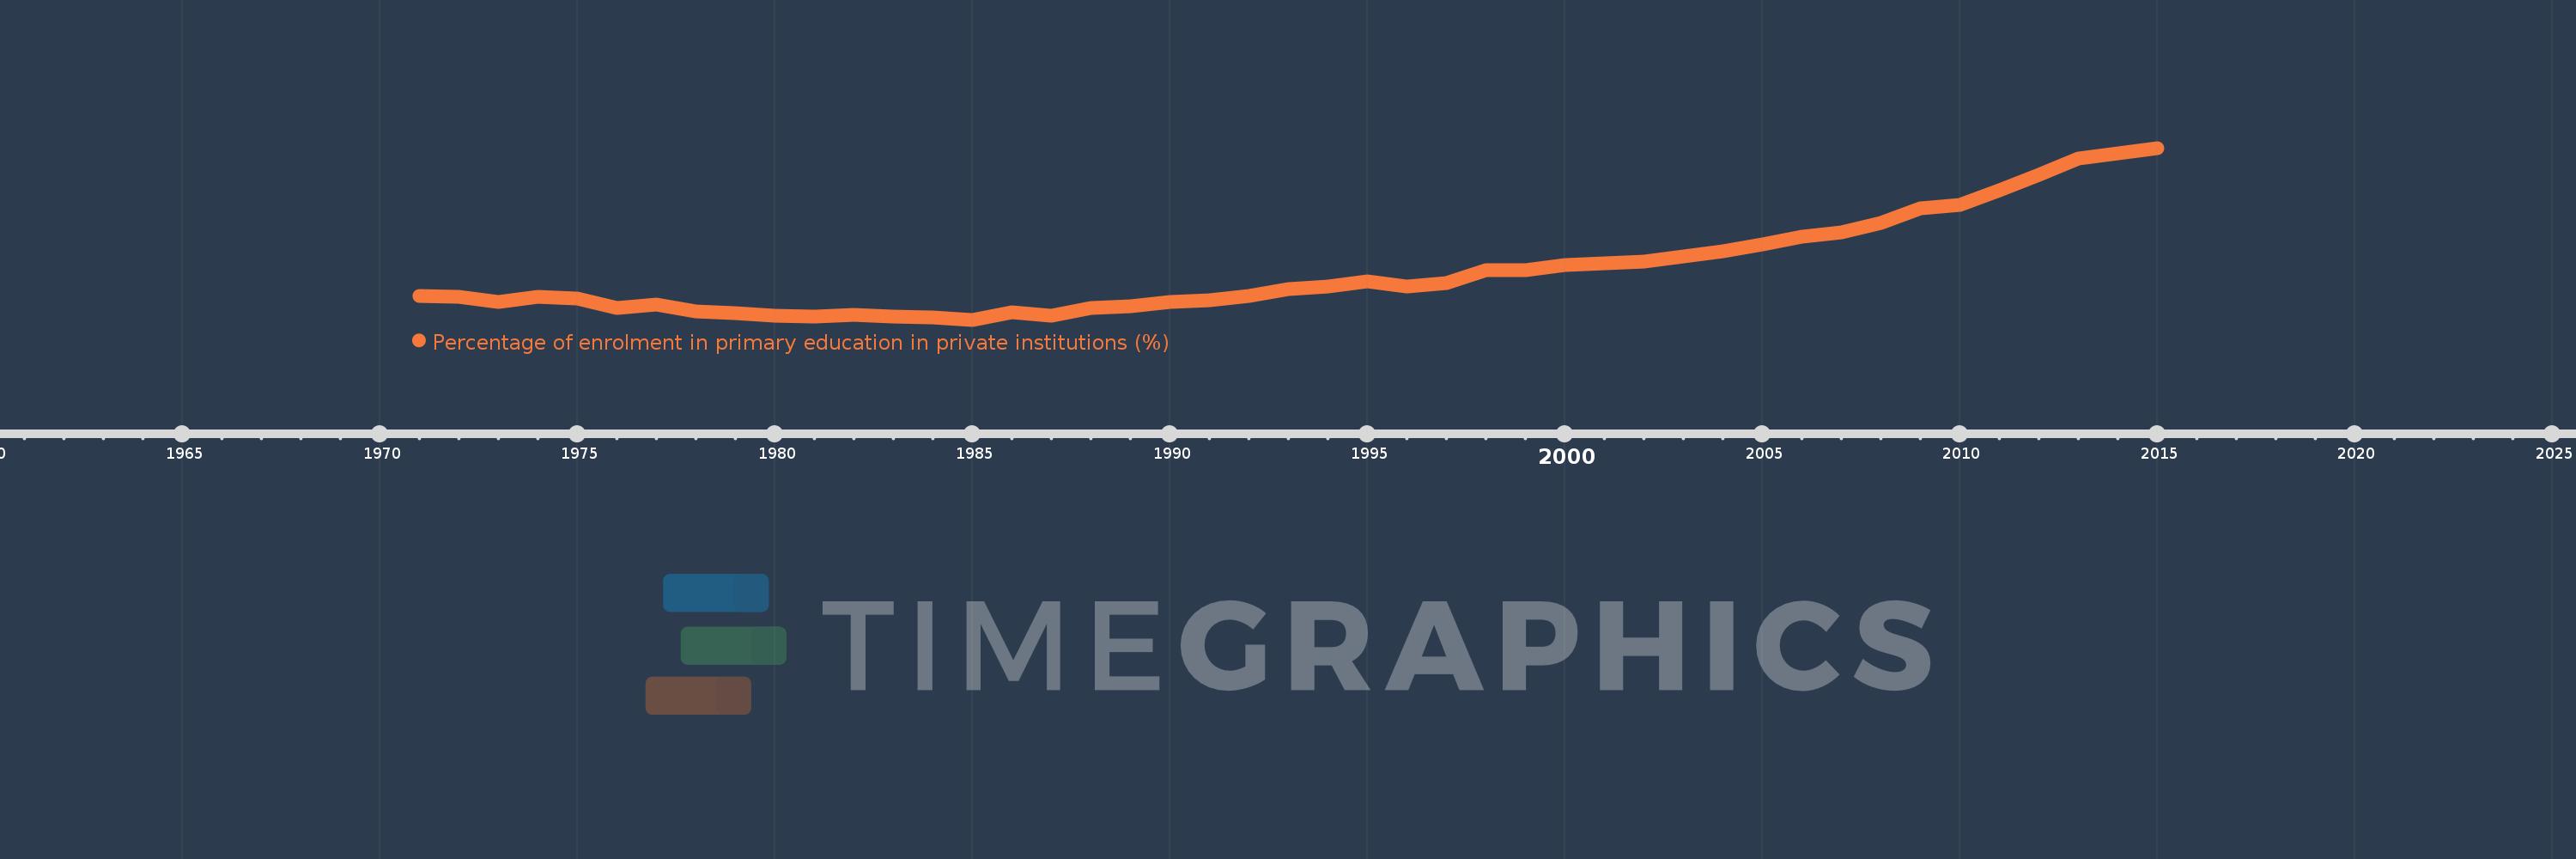
Percentage of enrolment in primary education in private institutions (%)
2015,2014,2013,2012,2011,2010,2009,2008,2007,2006,2005,2004,2003,2002,2001,2000,1999,1998,1997,1996,1995,1994,1993,1992,1991,1990,1989,1988,1987,1986,1985,1984,1983,1982,1981,1980,1979,1978,1977,1976,1975,1974,1973,1972,1971
This statistics in other country:
AfghanistanAlbaniaAlgeriaAndorraAngolaAntigua and BarbudaArab WorldArgentinaArmeniaArubaAustraliaAustriaAzerbaijanBahamas, TheBahrainBangladeshBarbadosBelarusBelgiumBelizeBeninBermudaBhutanBoliviaBosnia and HerzegovinaBotswanaBrazilBritish Virgin IslandsBrunei DarussalamBulgariaBurkina FasoBurundiCabo VerdeCambodiaCameroonCanadaCaribbean small statesCayman IslandsCentral African RepublicCentral Europe and the BalticsChadChileChinaColombiaComorosCongo, Dem. Rep.Congo, Rep.Costa RicaCote d'IvoireCroatiaCubaCuracaoCyprusCzech RepublicDenmarkDjiboutiDominicaDominican RepublicEarly-demographic dividendEast Asia & PacificEast Asia & Pacific (excluding high income)East Asia & Pacific (IDA & IBRD countries)EcuadorEgypt, Arab Rep.El SalvadorEquatorial GuineaEritreaEstoniaEthiopiaEuro areaEurope & Central AsiaEurope & Central Asia (excluding high income)Europe & Central Asia (IDA & IBRD countries)European UnionFijiFinlandFragile and conflict affected situationsFranceGabonGambia, TheGeorgiaGermanyGhanaGibraltarGreeceGrenadaGuatemalaGuineaGuinea-BissauGuyanaHaitiHeavily indebted poor countries (HIPC)High incomeHondurasHong Kong SAR, ChinaHungaryIBRD onlyIcelandIDA & IBRD totalIDA blendIDA onlyIDA totalIndiaIndonesiaIran, Islamic Rep.IraqIrelandIsraelItalyJamaicaJapanJordanKazakhstanKenyaKiribatiKorea, Rep.KuwaitKyrgyz RepublicLao PDRLate-demographic dividendLatin America & Caribbean Latin America & Caribbean (excluding high income)Latin America & the Caribbean (IDA & IBRD countries)LatviaLeast developed countries: UN classificationLebanonLesothoLiberiaLibyaLiechtensteinLithuaniaLow & middle incomeLow incomeLower middle incomeLuxembourgMacao SAR, ChinaMacedonia, FYRMadagascarMalawiMalaysiaMaldivesMaliMaltaMarshall IslandsMauritaniaMauritiusMexicoMiddle East & North AfricaMiddle East & North Africa (excluding high income)Middle East & North Africa (IDA & IBRD countries)Middle incomeMoldovaMonacoMongoliaMoroccoMozambiqueMyanmarNamibiaNauruNepalNetherlandsNew ZealandNicaraguaNigerNigeriaNorth AmericaNorwayOECD membersOmanOther small statesPacific island small statesPakistanPalauPanamaPapua New GuineaParaguayPeruPhilippinesPolandPortugalPost-demographic dividendPre-demographic dividendPuerto RicoQatarRomaniaRussian FederationRwandaSamoaSan MarinoSao Tome and PrincipeSaudi ArabiaSenegalSerbiaSeychellesSierra LeoneSingaporeSlovak RepublicSloveniaSmall statesSolomon IslandsSomaliaSouth AfricaSouth AsiaSouth Asia (IDA & IBRD)SpainSri LankaSt. Kitts and NevisSt. LuciaSt. Vincent and the GrenadinesSub-Saharan Africa Sub-Saharan Africa (excluding high income)Sub-Saharan Africa (IDA & IBRD countries)SudanSurinameSwazilandSwedenSwitzerlandSyrian Arab RepublicTajikistanTanzaniaThailandTimor-LesteTogoTongaTrinidad and TobagoTunisiaTurkeyTurks and Caicos IslandsTuvaluUgandaUkraineUnited Arab EmiratesUnited KingdomUnited StatesUpper middle incomeUruguayVanuatuVenezuela, RBVietnamWest Bank and GazaWorldYemen, Rep.ZambiaZimbabwe Timeline:
This timeline shows a graph from 1971 to 2015 of Latin America & the Caribbean (IDA & IBRD countries). No data until 1970. Number of actual observations by date: 45.
Source name:
World Development Indicators
Source organization:
UNESCO Institute for Statistics
Categories, topics:
Education
Last updated:
apr 23, 2017
Indicators value changes by year
Minimum:
11.579
jan 1, 1985
Maximum:
19.504
jan 1, 2015
At the date of observation
Value
Absolute change
Change from previous value
jan 1, 1971
12.693
+12.693
0.0%
jan 1, 1972
12.654
-0.039
-0.31%
jan 1, 1973
12.387
-0.267
-2.11%
jan 1, 1974
12.656
+0.269
2.17%
jan 1, 1975
12.539
-0.117
-0.93%
jan 1, 1976
12.113
-0.426
-3.4%
jan 1, 1977
12.261
+0.148
1.22%
jan 1, 1978
11.949
-0.312
-2.54%
jan 1, 1979
11.894
-0.056
-0.46%
jan 1, 1980
11.772
-0.122
-1.02%
jan 1, 1981
11.737
-0.035
-0.3%
jan 1, 1982
11.82
+0.084
0.71%
jan 1, 1983
11.74
-0.08
-0.68%
jan 1, 1984
11.673
-0.067
-0.57%
jan 1, 1985
11.579
-0.094
-0.81%
jan 1, 1986
11.93
+0.351
3.04%
jan 1, 1987
11.765
-0.165
-1.39%
jan 1, 1988
12.134
+0.369
3.14%
jan 1, 1989
12.205
+0.071
0.58%
jan 1, 1990
12.395
+0.19
1.56%
jan 1, 1991
12.473
+0.079
0.64%
jan 1, 1992
12.685
+0.212
1.7%
jan 1, 1993
13.002
+0.317
2.5%
jan 1, 1994
13.124
+0.122
0.94%
jan 1, 1995
13.338
+0.215
1.64%
jan 1, 1996
13.107
-0.231
-1.73%
jan 1, 1997
13.253
+0.146
1.12%
jan 1, 1998
13.863
+0.61
4.6%
jan 1, 1999
13.87
+0.006
0.05%
jan 1, 2000
14.115
+0.246
1.77%
jan 1, 2001
14.174
+0.059
0.42%
jan 1, 2002
14.26
+0.086
0.61%
jan 1, 2003
14.503
+0.243
1.7%
jan 1, 2004
14.741
+0.238
1.64%
jan 1, 2005
15.058
+0.317
2.15%
jan 1, 2006
15.398
+0.34
2.26%
jan 1, 2007
15.609
+0.211
1.37%
jan 1, 2008
16.046
+0.437
2.8%
jan 1, 2009
16.703
+0.657
4.1%
jan 1, 2010
16.864
+0.161
0.96%
jan 1, 2011
17.558
+0.694
4.11%
jan 1, 2012
18.25
+0.692
3.94%
jan 1, 2013
19.018
+0.768
4.21%
jan 1, 2014
19.252
+0.234
1.23%
jan 1, 2015
19.504
+0.251
1.31%
Ranking of countries by current statistics by years


Comments: