29
/
en
AIzaSyAYiBZKx7MnpbEhh9jyipgxe19OcubqV5w
April 1, 2024
25212
Caribbean small states
CSS
false
2
1
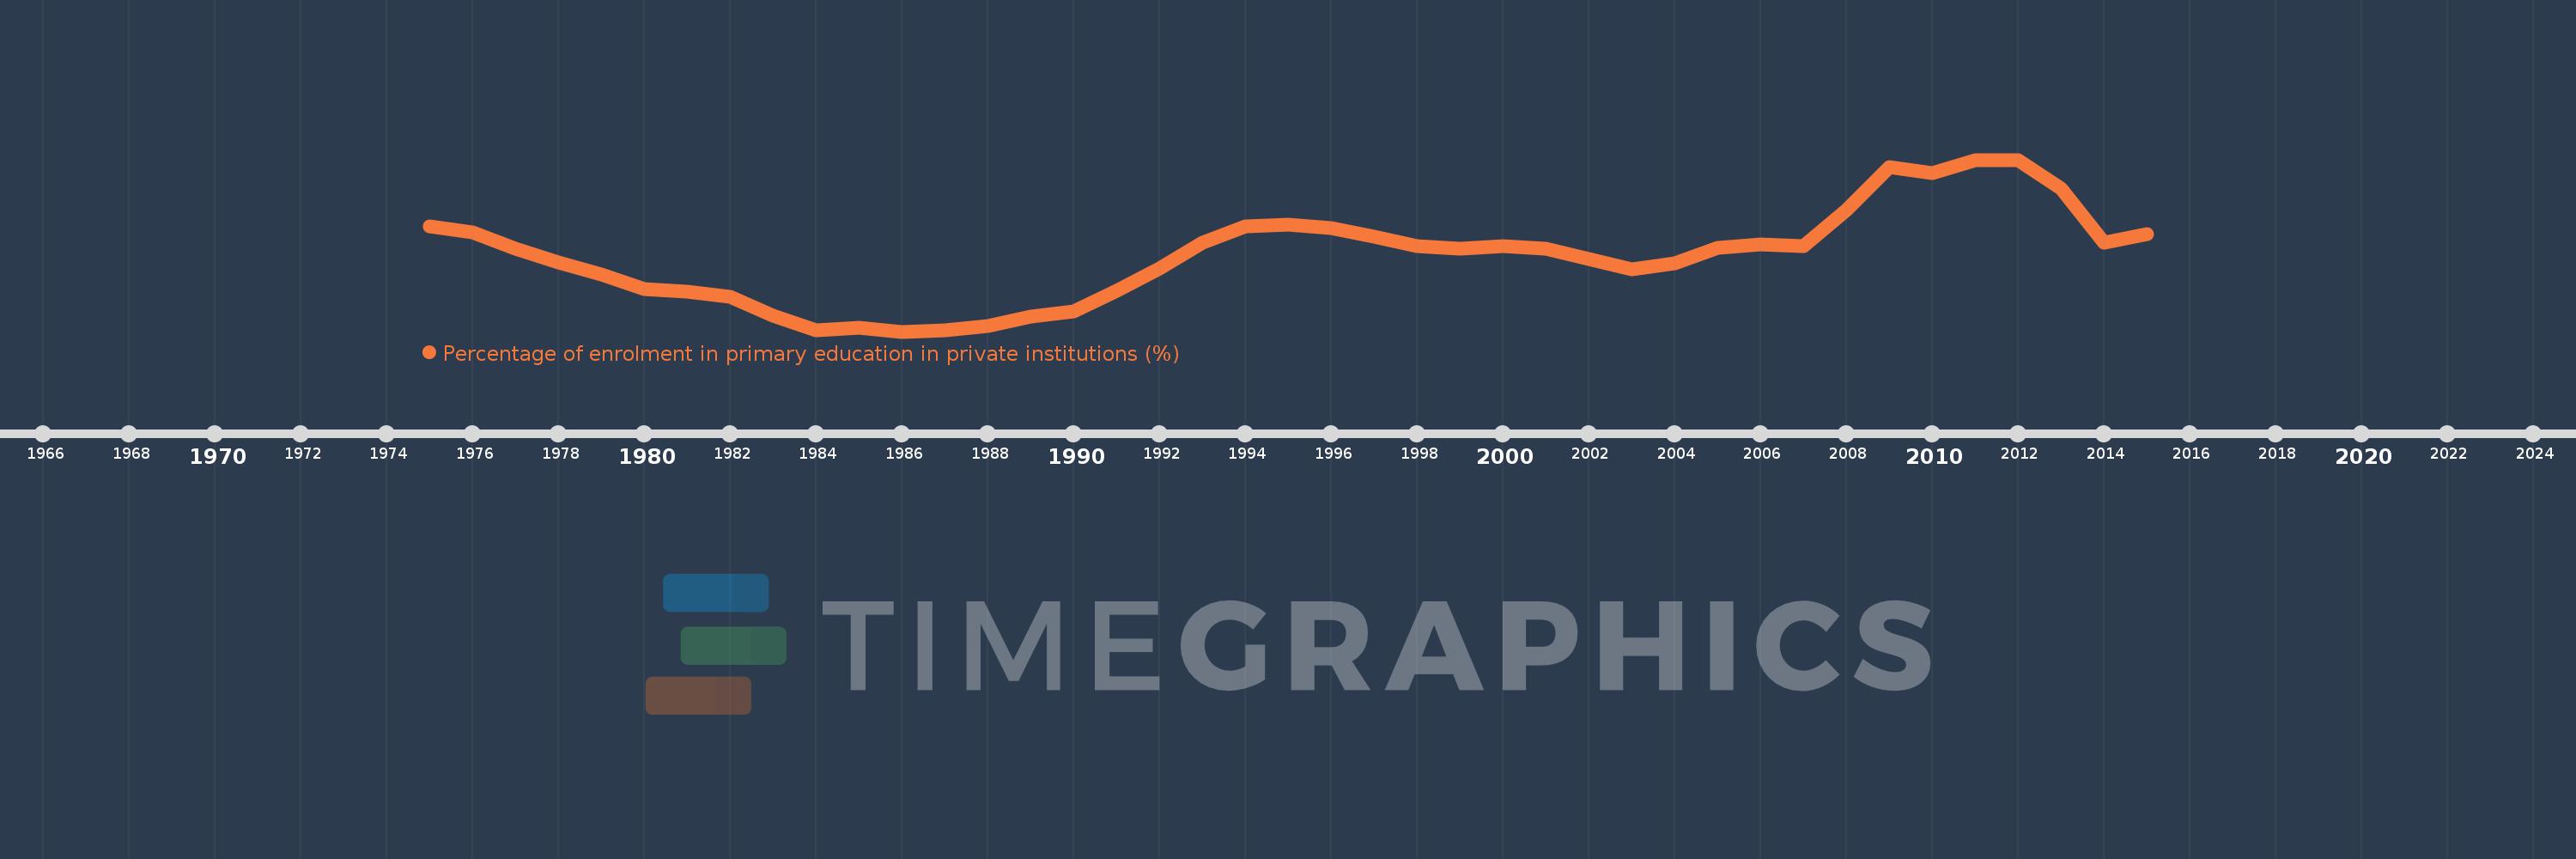
Percentage of enrolment in primary education in private institutions (%)
2015,2014,2013,2012,2011,2010,2009,2008,2007,2006,2005,2004,2003,2002,2001,2000,1999,1998,1997,1996,1995,1994,1993,1992,1991,1990,1989,1988,1987,1986,1985,1984,1983,1982,1981,1980,1979,1978,1977,1976,1975
This statistics in other country:
AfghanistanAlbaniaAlgeriaAndorraAngolaAntigua and BarbudaArab WorldArgentinaArmeniaArubaAustraliaAustriaAzerbaijanBahamas, TheBahrainBangladeshBarbadosBelarusBelgiumBelizeBeninBermudaBhutanBoliviaBosnia and HerzegovinaBotswanaBrazilBritish Virgin IslandsBrunei DarussalamBulgariaBurkina FasoBurundiCabo VerdeCambodiaCameroonCanadaCaribbean small statesCayman IslandsCentral African RepublicCentral Europe and the BalticsChadChileChinaColombiaComorosCongo, Dem. Rep.Congo, Rep.Costa RicaCote d'IvoireCroatiaCubaCuracaoCyprusCzech RepublicDenmarkDjiboutiDominicaDominican RepublicEarly-demographic dividendEast Asia & PacificEast Asia & Pacific (excluding high income)East Asia & Pacific (IDA & IBRD countries)EcuadorEgypt, Arab Rep.El SalvadorEquatorial GuineaEritreaEstoniaEthiopiaEuro areaEurope & Central AsiaEurope & Central Asia (excluding high income)Europe & Central Asia (IDA & IBRD countries)European UnionFijiFinlandFragile and conflict affected situationsFranceGabonGambia, TheGeorgiaGermanyGhanaGibraltarGreeceGrenadaGuatemalaGuineaGuinea-BissauGuyanaHaitiHeavily indebted poor countries (HIPC)High incomeHondurasHong Kong SAR, ChinaHungaryIBRD onlyIcelandIDA & IBRD totalIDA blendIDA onlyIDA totalIndiaIndonesiaIran, Islamic Rep.IraqIrelandIsraelItalyJamaicaJapanJordanKazakhstanKenyaKiribatiKorea, Rep.KuwaitKyrgyz RepublicLao PDRLate-demographic dividendLatin America & Caribbean Latin America & Caribbean (excluding high income)Latin America & the Caribbean (IDA & IBRD countries)LatviaLeast developed countries: UN classificationLebanonLesothoLiberiaLibyaLiechtensteinLithuaniaLow & middle incomeLow incomeLower middle incomeLuxembourgMacao SAR, ChinaMacedonia, FYRMadagascarMalawiMalaysiaMaldivesMaliMaltaMarshall IslandsMauritaniaMauritiusMexicoMiddle East & North AfricaMiddle East & North Africa (excluding high income)Middle East & North Africa (IDA & IBRD countries)Middle incomeMoldovaMonacoMongoliaMoroccoMozambiqueMyanmarNamibiaNauruNepalNetherlandsNew ZealandNicaraguaNigerNigeriaNorth AmericaNorwayOECD membersOmanOther small statesPacific island small statesPakistanPalauPanamaPapua New GuineaParaguayPeruPhilippinesPolandPortugalPost-demographic dividendPre-demographic dividendPuerto RicoQatarRomaniaRussian FederationRwandaSamoaSan MarinoSao Tome and PrincipeSaudi ArabiaSenegalSerbiaSeychellesSierra LeoneSingaporeSlovak RepublicSloveniaSmall statesSolomon IslandsSomaliaSouth AfricaSouth AsiaSouth Asia (IDA & IBRD)SpainSri LankaSt. Kitts and NevisSt. LuciaSt. Vincent and the GrenadinesSub-Saharan Africa Sub-Saharan Africa (excluding high income)Sub-Saharan Africa (IDA & IBRD countries)SudanSurinameSwazilandSwedenSwitzerlandSyrian Arab RepublicTajikistanTanzaniaThailandTimor-LesteTogoTongaTrinidad and TobagoTunisiaTurkeyTurks and Caicos IslandsTuvaluUgandaUkraineUnited Arab EmiratesUnited KingdomUnited StatesUpper middle incomeUruguayVanuatuVenezuela, RBVietnamWest Bank and GazaWorldYemen, Rep.ZambiaZimbabwe Timeline:
This timeline shows a graph from 1975 to 2015 of Caribbean small states. No data until 1974. Number of actual observations by date: 41.
Source name:
World Development Indicators
Source organization:
UNESCO Institute for Statistics
Categories, topics:
Education
Last updated:
apr 23, 2017
Indicators value changes by year
Minimum:
23.734
jan 1, 1986
Maximum:
31.447
jan 1, 2011
At the date of observation
Value
Absolute change
Change from previous value
jan 1, 1975
28.45
+28.45
0.0%
jan 1, 1976
28.175
-0.275
-0.97%
jan 1, 1977
27.474
-0.701
-2.49%
jan 1, 1978
26.856
-0.618
-2.25%
jan 1, 1979
26.305
-0.55
-2.05%
jan 1, 1980
25.631
-0.674
-2.56%
jan 1, 1981
25.51
-0.121
-0.47%
jan 1, 1982
25.303
-0.207
-0.81%
jan 1, 1983
24.435
-0.868
-3.43%
jan 1, 1984
23.796
-0.639
-2.62%
jan 1, 1985
23.917
+0.121
0.51%
jan 1, 1986
23.734
-0.182
-0.76%
jan 1, 1987
23.786
+0.052
0.22%
jan 1, 1988
23.993
+0.207
0.87%
jan 1, 1989
24.424
+0.431
1.8%
jan 1, 1990
24.636
+0.212
0.87%
jan 1, 1991
25.576
+0.94
3.81%
jan 1, 1992
26.586
+1.01
3.95%
jan 1, 1993
27.713
+1.127
4.24%
jan 1, 1994
28.444
+0.731
2.64%
jan 1, 1995
28.545
+0.1
0.35%
jan 1, 1996
28.374
-0.17
-0.6%
jan 1, 1997
28.008
-0.366
-1.29%
jan 1, 1998
27.589
-0.419
-1.5%
jan 1, 1999
27.46
-0.129
-0.47%
jan 1, 2000
27.58
+0.12
0.44%
jan 1, 2001
27.45
-0.13
-0.47%
jan 1, 2002
27.008
-0.442
-1.61%
jan 1, 2003
26.523
-0.485
-1.79%
jan 1, 2004
26.783
+0.26
0.98%
jan 1, 2005
27.509
+0.726
2.71%
jan 1, 2006
27.663
+0.154
0.56%
jan 1, 2007
27.552
-0.111
-0.4%
jan 1, 2008
29.186
+1.634
5.93%
jan 1, 2009
31.108
+1.923
6.59%
jan 1, 2010
30.839
-0.27
-0.87%
jan 1, 2011
31.447
+0.608
1.97%
jan 1, 2012
31.415
-0.032
-0.1%
jan 1, 2013
30.173
-1.242
-3.95%
jan 1, 2014
27.707
-2.466
-8.17%
jan 1, 2015
28.121
+0.414
1.49%
Ranking of countries by current statistics by years


Comments: