29
/
en
AIzaSyAYiBZKx7MnpbEhh9jyipgxe19OcubqV5w
April 1, 2024
30189
Euro area
EMU
false
2
1
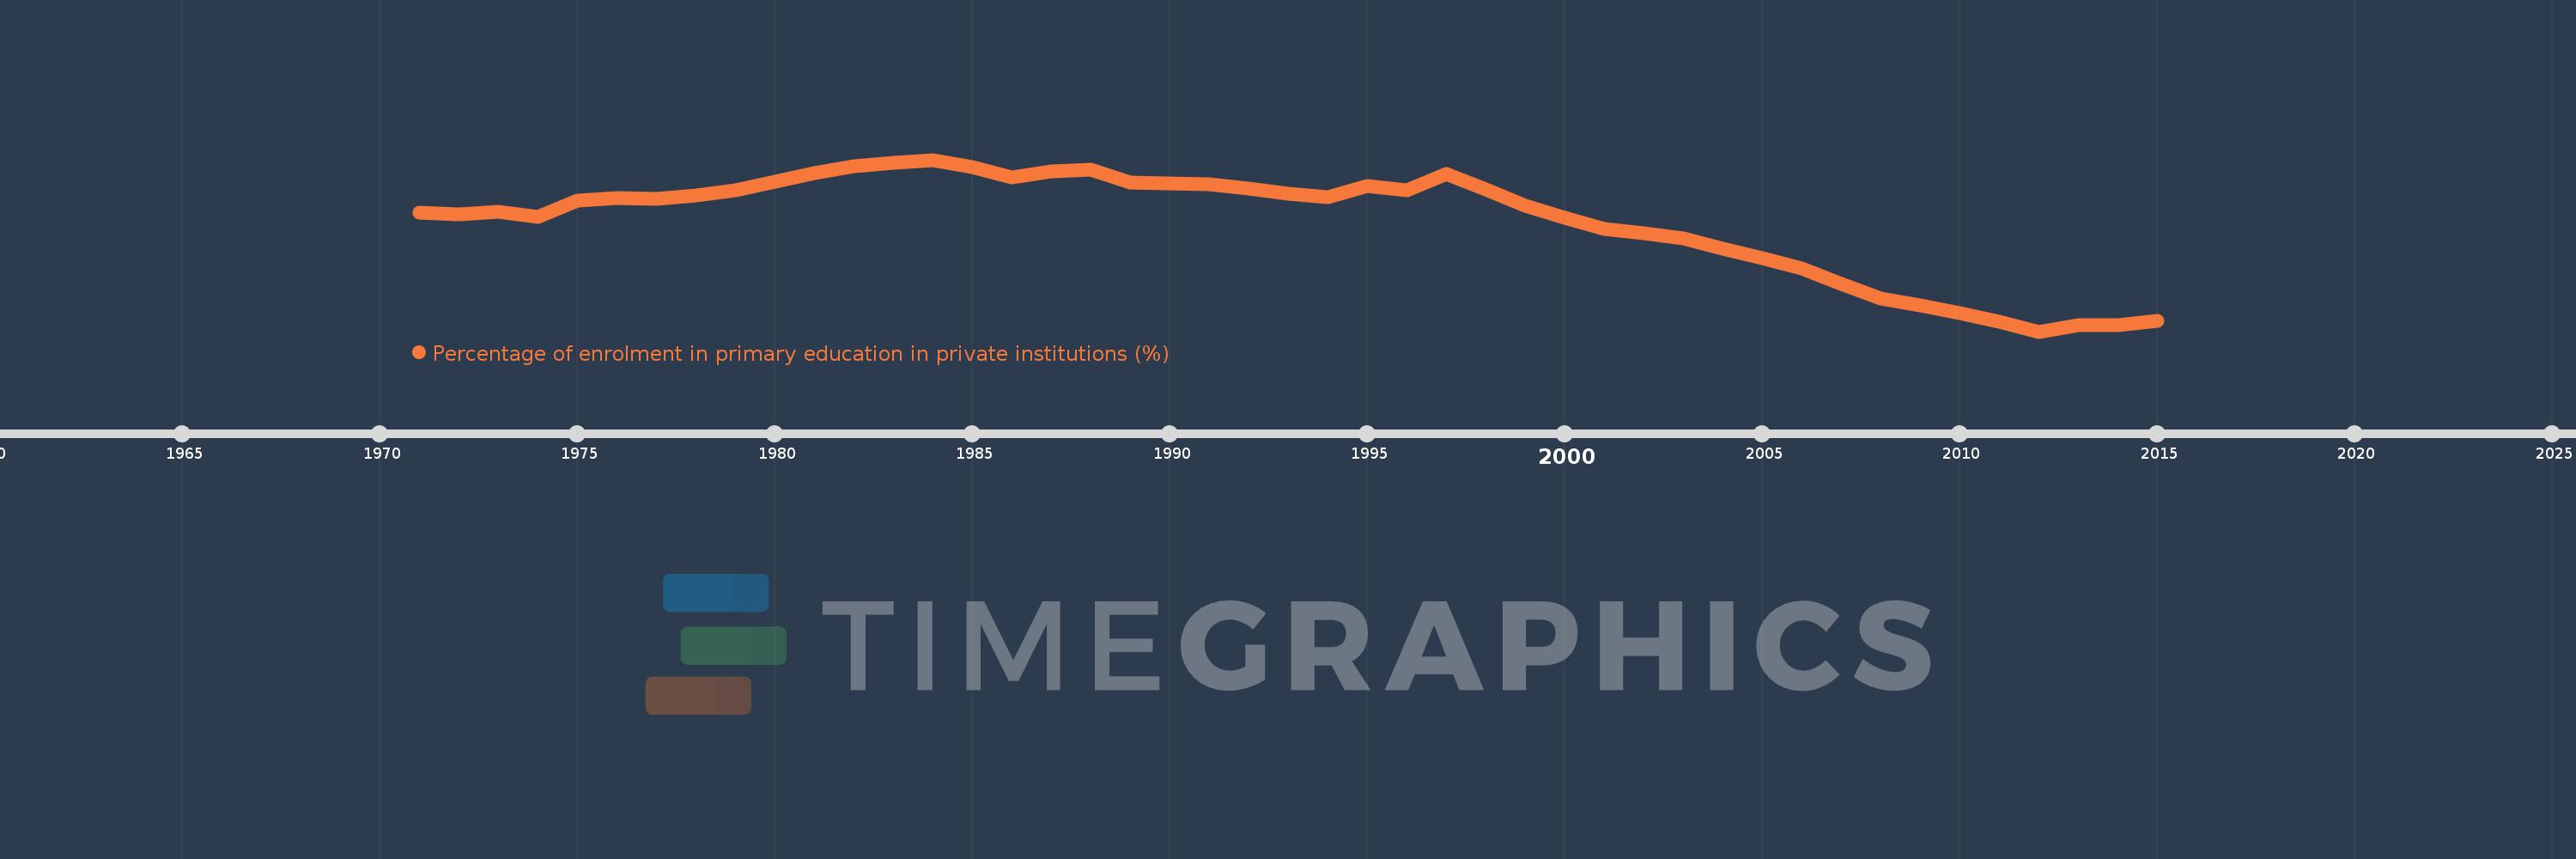
Percentage of enrolment in primary education in private institutions (%)
2015,2014,2013,2012,2011,2010,2009,2008,2007,2006,2005,2004,2003,2002,2001,2000,1999,1998,1997,1996,1995,1994,1993,1992,1991,1990,1989,1988,1987,1986,1985,1984,1983,1982,1981,1980,1979,1978,1977,1976,1975,1974,1973,1972,1971
This statistics in other country:
AfghanistanAlbaniaAlgeriaAndorraAngolaAntigua and BarbudaArab WorldArgentinaArmeniaArubaAustraliaAustriaAzerbaijanBahamas, TheBahrainBangladeshBarbadosBelarusBelgiumBelizeBeninBermudaBhutanBoliviaBosnia and HerzegovinaBotswanaBrazilBritish Virgin IslandsBrunei DarussalamBulgariaBurkina FasoBurundiCabo VerdeCambodiaCameroonCanadaCaribbean small statesCayman IslandsCentral African RepublicCentral Europe and the BalticsChadChileChinaColombiaComorosCongo, Dem. Rep.Congo, Rep.Costa RicaCote d'IvoireCroatiaCubaCuracaoCyprusCzech RepublicDenmarkDjiboutiDominicaDominican RepublicEarly-demographic dividendEast Asia & PacificEast Asia & Pacific (excluding high income)East Asia & Pacific (IDA & IBRD countries)EcuadorEgypt, Arab Rep.El SalvadorEquatorial GuineaEritreaEstoniaEthiopiaEuro areaEurope & Central AsiaEurope & Central Asia (excluding high income)Europe & Central Asia (IDA & IBRD countries)European UnionFijiFinlandFragile and conflict affected situationsFranceGabonGambia, TheGeorgiaGermanyGhanaGibraltarGreeceGrenadaGuatemalaGuineaGuinea-BissauGuyanaHaitiHeavily indebted poor countries (HIPC)High incomeHondurasHong Kong SAR, ChinaHungaryIBRD onlyIcelandIDA & IBRD totalIDA blendIDA onlyIDA totalIndiaIndonesiaIran, Islamic Rep.IraqIrelandIsraelItalyJamaicaJapanJordanKazakhstanKenyaKiribatiKorea, Rep.KuwaitKyrgyz RepublicLao PDRLate-demographic dividendLatin America & Caribbean Latin America & Caribbean (excluding high income)Latin America & the Caribbean (IDA & IBRD countries)LatviaLeast developed countries: UN classificationLebanonLesothoLiberiaLibyaLiechtensteinLithuaniaLow & middle incomeLow incomeLower middle incomeLuxembourgMacao SAR, ChinaMacedonia, FYRMadagascarMalawiMalaysiaMaldivesMaliMaltaMarshall IslandsMauritaniaMauritiusMexicoMiddle East & North AfricaMiddle East & North Africa (excluding high income)Middle East & North Africa (IDA & IBRD countries)Middle incomeMoldovaMonacoMongoliaMoroccoMozambiqueMyanmarNamibiaNauruNepalNetherlandsNew ZealandNicaraguaNigerNigeriaNorth AmericaNorwayOECD membersOmanOther small statesPacific island small statesPakistanPalauPanamaPapua New GuineaParaguayPeruPhilippinesPolandPortugalPost-demographic dividendPre-demographic dividendPuerto RicoQatarRomaniaRussian FederationRwandaSamoaSan MarinoSao Tome and PrincipeSaudi ArabiaSenegalSerbiaSeychellesSierra LeoneSingaporeSlovak RepublicSloveniaSmall statesSolomon IslandsSomaliaSouth AfricaSouth AsiaSouth Asia (IDA & IBRD)SpainSri LankaSt. Kitts and NevisSt. LuciaSt. Vincent and the GrenadinesSub-Saharan Africa Sub-Saharan Africa (excluding high income)Sub-Saharan Africa (IDA & IBRD countries)SudanSurinameSwazilandSwedenSwitzerlandSyrian Arab RepublicTajikistanTanzaniaThailandTimor-LesteTogoTongaTrinidad and TobagoTunisiaTurkeyTurks and Caicos IslandsTuvaluUgandaUkraineUnited Arab EmiratesUnited KingdomUnited StatesUpper middle incomeUruguayVanuatuVenezuela, RBVietnamWest Bank and GazaWorldYemen, Rep.ZambiaZimbabwe Timeline:
This timeline shows a graph from 1971 to 2015 of Euro area. No data until 1970. Number of actual observations by date: 45.
Source name:
World Development Indicators
Source organization:
UNESCO Institute for Statistics
Categories, topics:
Education
Last updated:
apr 23, 2017
Indicators value changes by year
Minimum:
13.516
jan 1, 2012
Maximum:
17.151
jan 1, 1984
At the date of observation
Value
Absolute change
Change from previous value
jan 1, 1971
16.039
+16.039
0.0%
jan 1, 1972
16.004
-0.035
-0.22%
jan 1, 1973
16.043
+0.039
0.25%
jan 1, 1974
15.944
-0.099
-0.62%
jan 1, 1975
16.293
+0.349
2.19%
jan 1, 1976
16.338
+0.045
0.28%
jan 1, 1977
16.323
-0.014
-0.09%
jan 1, 1978
16.401
+0.078
0.48%
jan 1, 1979
16.514
+0.112
0.68%
jan 1, 1980
16.687
+0.173
1.05%
jan 1, 1981
16.871
+0.184
1.1%
jan 1, 1982
17.017
+0.146
0.86%
jan 1, 1983
17.085
+0.068
0.4%
jan 1, 1984
17.151
+0.066
0.39%
jan 1, 1985
16.996
-0.155
-0.9%
jan 1, 1986
16.777
-0.219
-1.29%
jan 1, 1987
16.914
+0.137
0.82%
jan 1, 1988
16.937
+0.023
0.14%
jan 1, 1989
16.664
-0.273
-1.61%
jan 1, 1990
16.657
-0.007
-0.04%
jan 1, 1991
16.636
-0.021
-0.13%
jan 1, 1992
16.544
-0.092
-0.55%
jan 1, 1993
16.43
-0.115
-0.69%
jan 1, 1994
16.363
-0.066
-0.4%
jan 1, 1995
16.601
+0.237
1.45%
jan 1, 1996
16.499
-0.102
-0.61%
jan 1, 1997
16.846
+0.348
2.11%
jan 1, 1998
16.524
-0.322
-1.91%
jan 1, 1999
16.173
-0.351
-2.13%
jan 1, 2000
15.925
-0.248
-1.53%
jan 1, 2001
15.688
-0.237
-1.49%
jan 1, 2002
15.589
-0.099
-0.63%
jan 1, 2003
15.484
-0.105
-0.68%
jan 1, 2004
15.272
-0.212
-1.37%
jan 1, 2005
15.061
-0.212
-1.39%
jan 1, 2006
14.853
-0.208
-1.38%
jan 1, 2007
14.522
-0.331
-2.23%
jan 1, 2008
14.221
-0.301
-2.07%
jan 1, 2009
14.069
-0.152
-1.07%
jan 1, 2010
13.912
-0.157
-1.11%
jan 1, 2011
13.716
-0.196
-1.41%
jan 1, 2012
13.516
-0.199
-1.45%
jan 1, 2013
13.647
+0.131
0.97%
jan 1, 2014
13.658
+0.011
0.08%
jan 1, 2015
13.739
+0.082
0.6%
Ranking of countries by current statistics by years


Comments: