29
/
en
AIzaSyAYiBZKx7MnpbEhh9jyipgxe19OcubqV5w
April 1, 2024
212147
Niger
NER
true
2
1
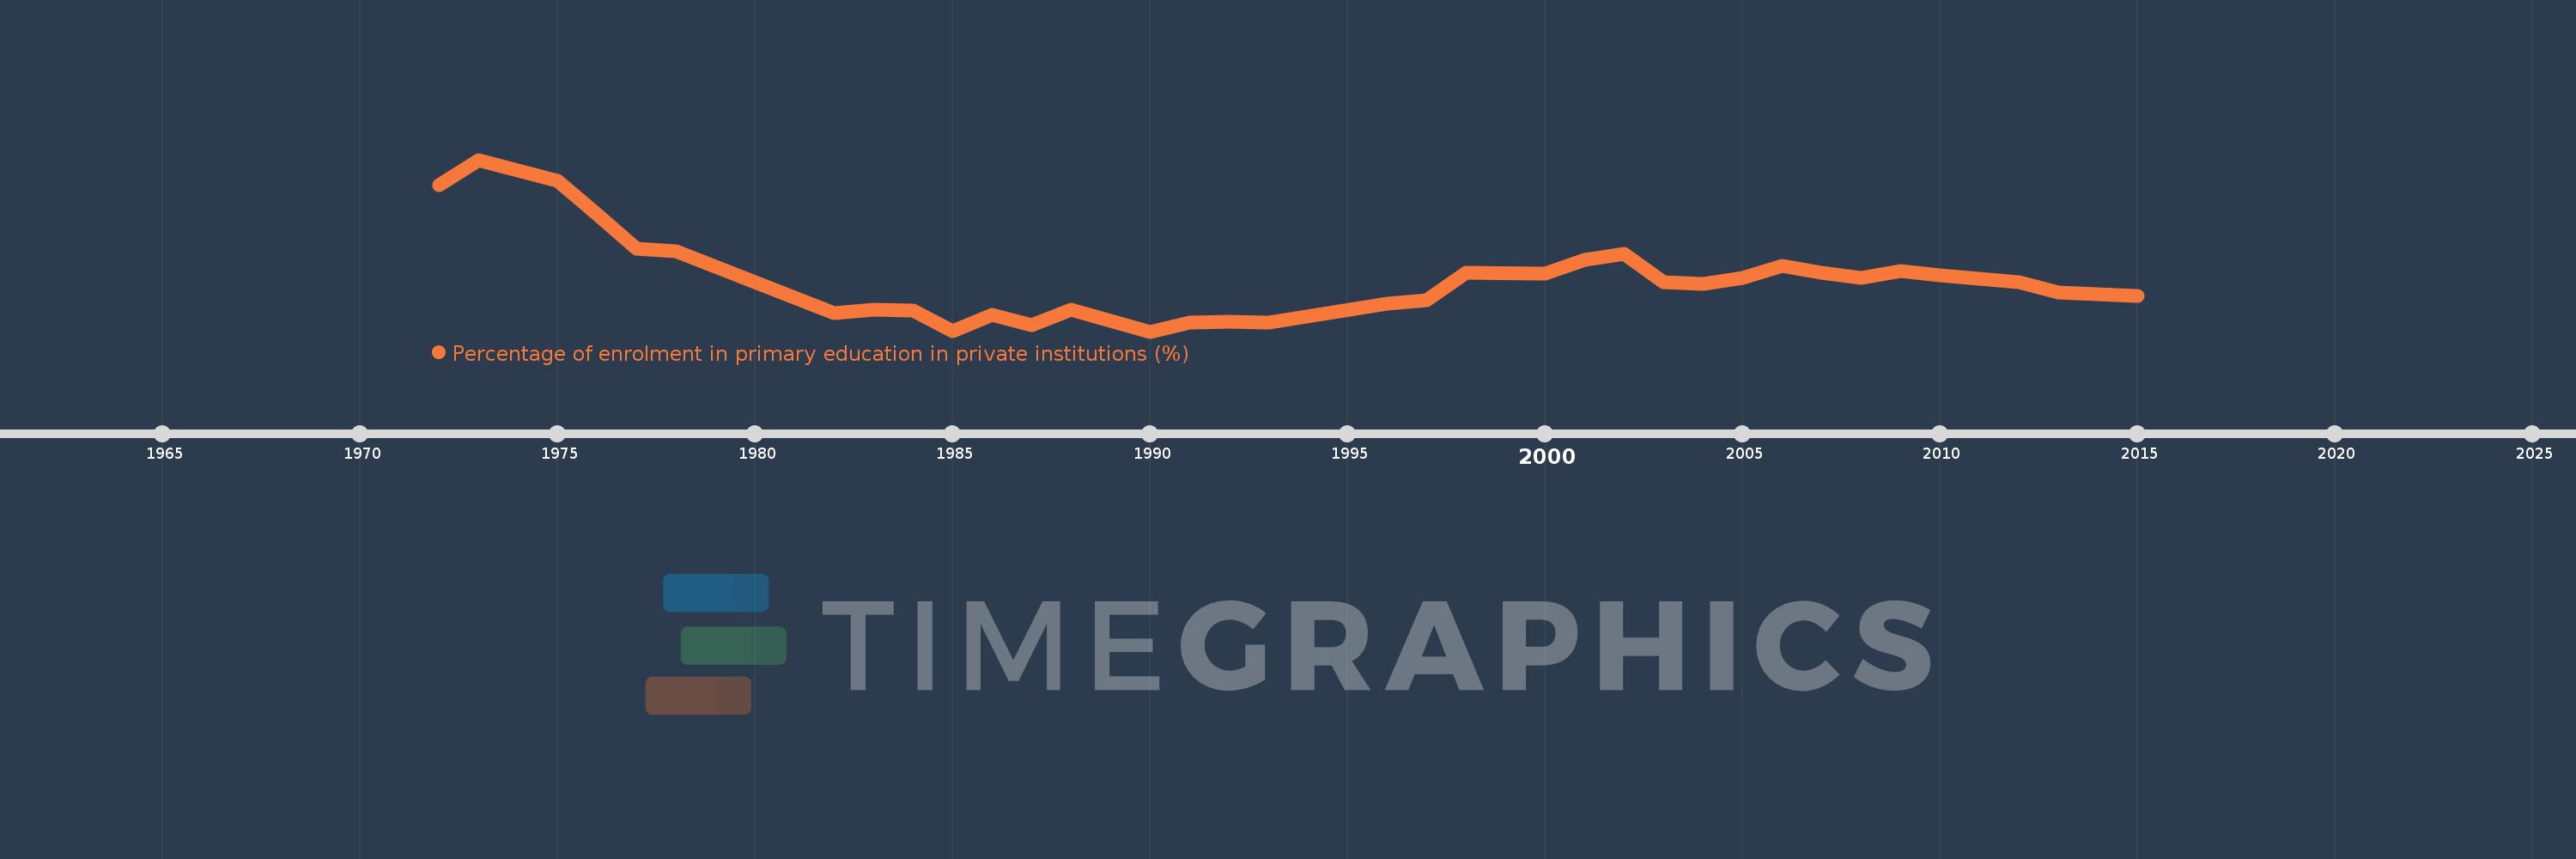
Percentage of enrolment in primary education in private institutions (%)
2015,2014,2013,2012,2011,2010,2009,2008,2007,2006,2005,2004,2003,2002,2001,2000,1998,1997,1996,1993,1992,1991,1990,1988,1987,1986,1985,1984,1983,1982,1978,1977,1976,1975,1974,1973,1972
This statistics in other country:
AfghanistanAlbaniaAlgeriaAndorraAngolaAntigua and BarbudaArab WorldArgentinaArmeniaArubaAustraliaAustriaAzerbaijanBahamas, TheBahrainBangladeshBarbadosBelarusBelgiumBelizeBeninBermudaBhutanBoliviaBosnia and HerzegovinaBotswanaBrazilBritish Virgin IslandsBrunei DarussalamBulgariaBurkina FasoBurundiCabo VerdeCambodiaCameroonCanadaCaribbean small statesCayman IslandsCentral African RepublicCentral Europe and the BalticsChadChileChinaColombiaComorosCongo, Dem. Rep.Congo, Rep.Costa RicaCote d'IvoireCroatiaCubaCuracaoCyprusCzech RepublicDenmarkDjiboutiDominicaDominican RepublicEarly-demographic dividendEast Asia & PacificEast Asia & Pacific (excluding high income)East Asia & Pacific (IDA & IBRD countries)EcuadorEgypt, Arab Rep.El SalvadorEquatorial GuineaEritreaEstoniaEthiopiaEuro areaEurope & Central AsiaEurope & Central Asia (excluding high income)Europe & Central Asia (IDA & IBRD countries)European UnionFijiFinlandFragile and conflict affected situationsFranceGabonGambia, TheGeorgiaGermanyGhanaGibraltarGreeceGrenadaGuatemalaGuineaGuinea-BissauGuyanaHaitiHeavily indebted poor countries (HIPC)High incomeHondurasHong Kong SAR, ChinaHungaryIBRD onlyIcelandIDA & IBRD totalIDA blendIDA onlyIDA totalIndiaIndonesiaIran, Islamic Rep.IraqIrelandIsraelItalyJamaicaJapanJordanKazakhstanKenyaKiribatiKorea, Rep.KuwaitKyrgyz RepublicLao PDRLate-demographic dividendLatin America & Caribbean Latin America & Caribbean (excluding high income)Latin America & the Caribbean (IDA & IBRD countries)LatviaLeast developed countries: UN classificationLebanonLesothoLiberiaLibyaLiechtensteinLithuaniaLow & middle incomeLow incomeLower middle incomeLuxembourgMacao SAR, ChinaMacedonia, FYRMadagascarMalawiMalaysiaMaldivesMaliMaltaMarshall IslandsMauritaniaMauritiusMexicoMiddle East & North AfricaMiddle East & North Africa (excluding high income)Middle East & North Africa (IDA & IBRD countries)Middle incomeMoldovaMonacoMongoliaMoroccoMozambiqueMyanmarNamibiaNauruNepalNetherlandsNew ZealandNicaraguaNigerNigeriaNorth AmericaNorwayOECD membersOmanOther small statesPacific island small statesPakistanPalauPanamaPapua New GuineaParaguayPeruPhilippinesPolandPortugalPost-demographic dividendPre-demographic dividendPuerto RicoQatarRomaniaRussian FederationRwandaSamoaSan MarinoSao Tome and PrincipeSaudi ArabiaSenegalSerbiaSeychellesSierra LeoneSingaporeSlovak RepublicSloveniaSmall statesSolomon IslandsSomaliaSouth AfricaSouth AsiaSouth Asia (IDA & IBRD)SpainSri LankaSt. Kitts and NevisSt. LuciaSt. Vincent and the GrenadinesSub-Saharan Africa Sub-Saharan Africa (excluding high income)Sub-Saharan Africa (IDA & IBRD countries)SudanSurinameSwazilandSwedenSwitzerlandSyrian Arab RepublicTajikistanTanzaniaThailandTimor-LesteTogoTongaTrinidad and TobagoTunisiaTurkeyTurks and Caicos IslandsTuvaluUgandaUkraineUnited Arab EmiratesUnited KingdomUnited StatesUpper middle incomeUruguayVanuatuVenezuela, RBVietnamWest Bank and GazaWorldYemen, Rep.ZambiaZimbabwe Timeline:
This timeline shows a graph from 1972 to 2015 of Niger. No data until 1971. Number of actual observations by date: 37.
Source name:
World Development Indicators
Source organization:
UNESCO Institute for Statistics
Categories, topics:
Education
Last updated:
apr 23, 2017
Indicators value changes by year
At the date of observation
Value
Absolute change
Change from previous value
jan 1, 1972
6.128
+6.128
0.0%
jan 1, 1973
6.742
+0.614
10.02%
jan 1, 1974
6.475
-0.267
-3.96%
jan 1, 1975
6.229
-0.246
-3.8%
jan 1, 1976
5.403
-0.826
-13.26%
jan 1, 1977
4.574
-0.829
-15.34%
jan 1, 1978
4.51
-0.064
-1.41%
jan 1, 1982
2.995
-1.515
-33.59%
jan 1, 1983
3.079
+0.084
2.81%
jan 1, 1984
3.055
-0.024
-0.76%
jan 1, 1985
2.562
-0.493
-16.14%
jan 1, 1986
2.951
+0.388
15.16%
jan 1, 1987
2.693
-0.257
-8.73%
jan 1, 1988
3.085
+0.392
14.56%
jan 1, 1990
2.544
-0.541
-17.55%
jan 1, 1991
2.765
+0.221
8.69%
jan 1, 1992
2.782
+0.017
0.6%
jan 1, 1993
2.77
-0.011
-0.41%
jan 1, 1996
3.227
+0.457
16.5%
jan 1, 1997
3.313
+0.086
2.67%
jan 1, 1998
3.975
+0.662
19.97%
jan 1, 2000
3.963
-0.013
-0.32%
jan 1, 2001
4.299
+0.336
8.48%
jan 1, 2002
4.435
+0.136
3.17%
jan 1, 2003
3.756
-0.679
-15.3%
jan 1, 2004
3.718
-0.039
-1.03%
jan 1, 2005
3.852
+0.134
3.6%
jan 1, 2006
4.14
+0.289
7.5%
jan 1, 2007
3.99
-0.151
-3.64%
jan 1, 2008
3.854
-0.135
-3.39%
jan 1, 2009
4.031
+0.177
4.58%
jan 1, 2010
3.928
-0.103
-2.55%
jan 1, 2011
3.831
-0.097
-2.46%
jan 1, 2012
3.751
-0.08
-2.1%
jan 1, 2013
3.494
-0.257
-6.85%
jan 1, 2014
3.461
-0.033
-0.96%
jan 1, 2015
3.414
-0.047
-1.35%
Ranking of countries by current statistics by years


Comments: