29
/
en
AIzaSyAYiBZKx7MnpbEhh9jyipgxe19OcubqV5w
April 1, 2024
92903
Brunei Darussalam
BRN
true
2
1
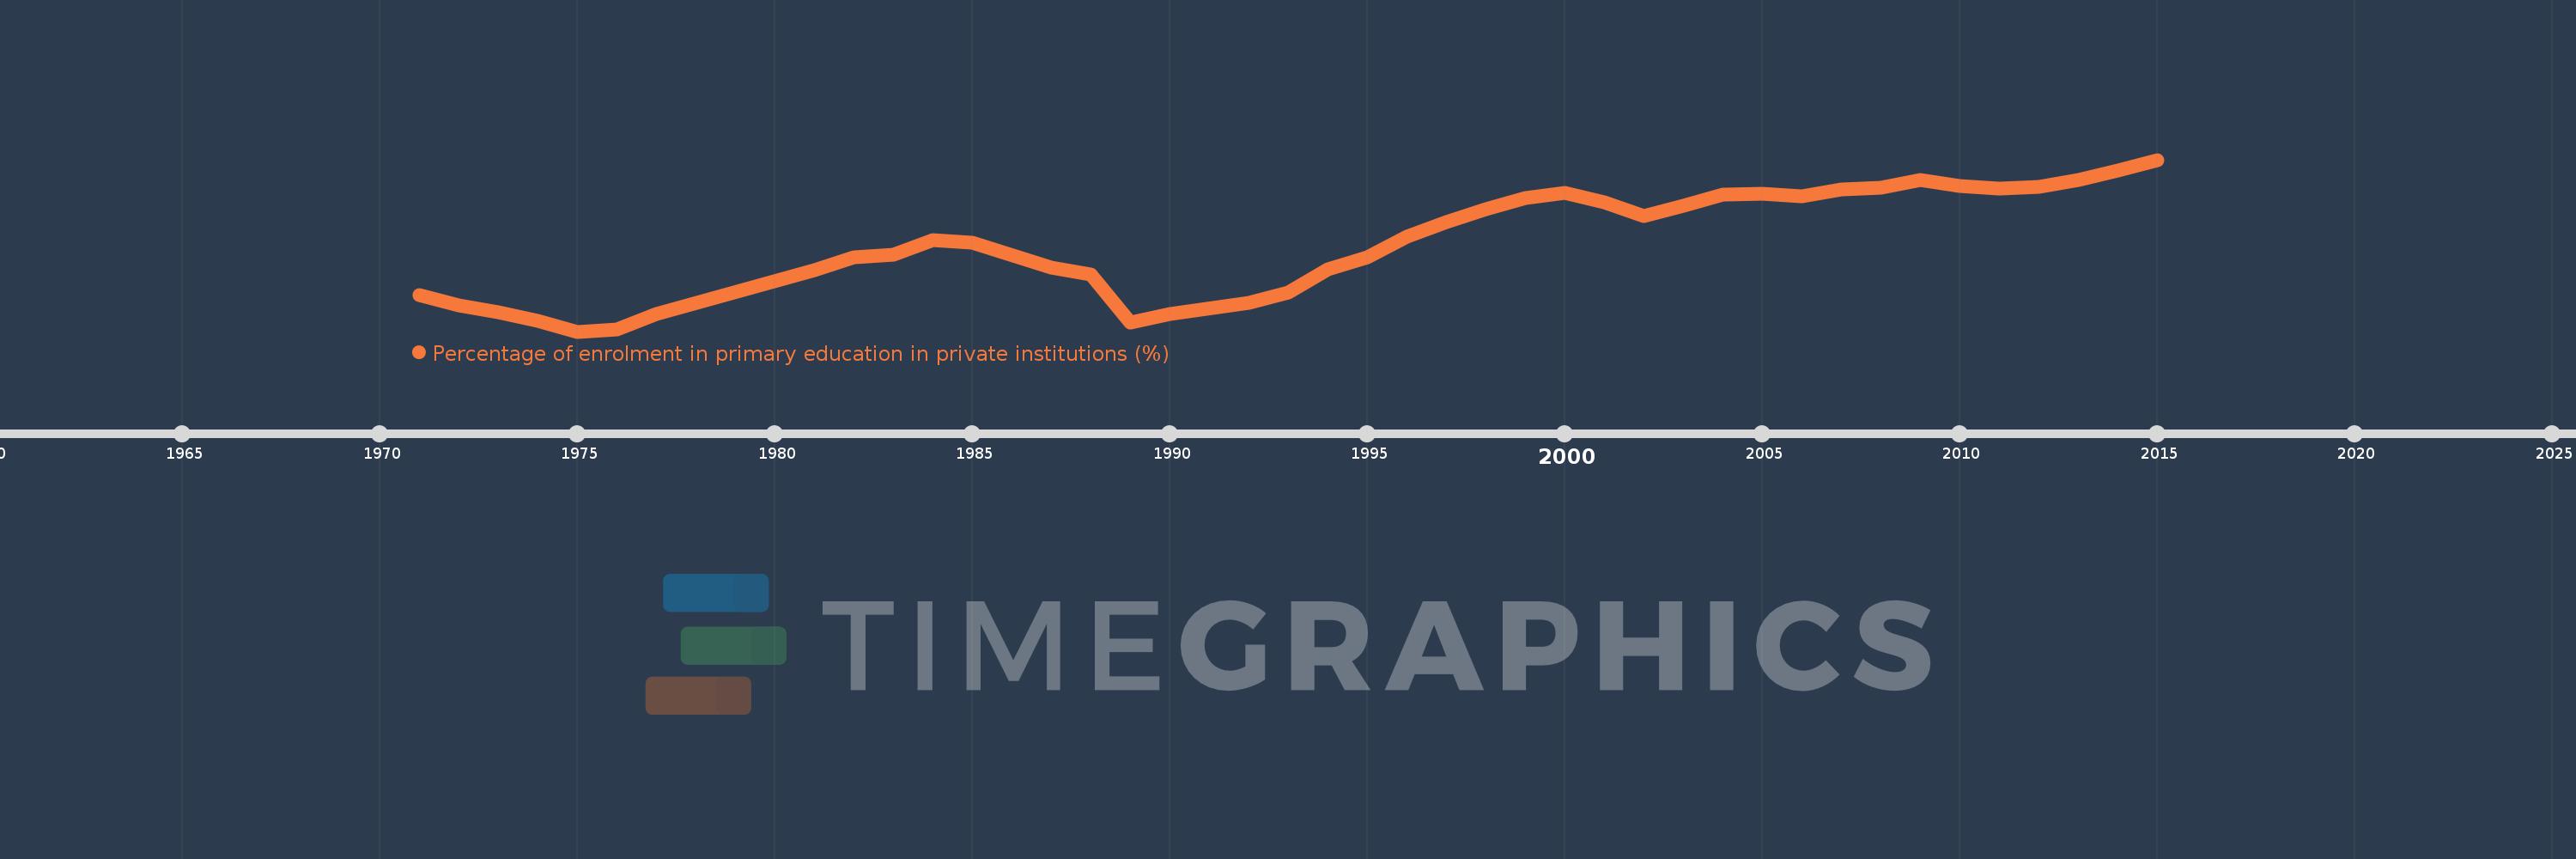
Percentage of enrolment in primary education in private institutions (%)
2015,2014,2013,2012,2011,2010,2009,2008,2007,2006,2005,2004,2003,2002,2001,2000,1999,1998,1997,1996,1995,1994,1993,1992,1990,1989,1988,1987,1985,1984,1983,1982,1981,1977,1976,1975,1974,1973,1972,1971
This statistics in other country:
AfghanistanAlbaniaAlgeriaAndorraAngolaAntigua and BarbudaArab WorldArgentinaArmeniaArubaAustraliaAustriaAzerbaijanBahamas, TheBahrainBangladeshBarbadosBelarusBelgiumBelizeBeninBermudaBhutanBoliviaBosnia and HerzegovinaBotswanaBrazilBritish Virgin IslandsBrunei DarussalamBulgariaBurkina FasoBurundiCabo VerdeCambodiaCameroonCanadaCaribbean small statesCayman IslandsCentral African RepublicCentral Europe and the BalticsChadChileChinaColombiaComorosCongo, Dem. Rep.Congo, Rep.Costa RicaCote d'IvoireCroatiaCubaCuracaoCyprusCzech RepublicDenmarkDjiboutiDominicaDominican RepublicEarly-demographic dividendEast Asia & PacificEast Asia & Pacific (excluding high income)East Asia & Pacific (IDA & IBRD countries)EcuadorEgypt, Arab Rep.El SalvadorEquatorial GuineaEritreaEstoniaEthiopiaEuro areaEurope & Central AsiaEurope & Central Asia (excluding high income)Europe & Central Asia (IDA & IBRD countries)European UnionFijiFinlandFragile and conflict affected situationsFranceGabonGambia, TheGeorgiaGermanyGhanaGibraltarGreeceGrenadaGuatemalaGuineaGuinea-BissauGuyanaHaitiHeavily indebted poor countries (HIPC)High incomeHondurasHong Kong SAR, ChinaHungaryIBRD onlyIcelandIDA & IBRD totalIDA blendIDA onlyIDA totalIndiaIndonesiaIran, Islamic Rep.IraqIrelandIsraelItalyJamaicaJapanJordanKazakhstanKenyaKiribatiKorea, Rep.KuwaitKyrgyz RepublicLao PDRLate-demographic dividendLatin America & Caribbean Latin America & Caribbean (excluding high income)Latin America & the Caribbean (IDA & IBRD countries)LatviaLeast developed countries: UN classificationLebanonLesothoLiberiaLibyaLiechtensteinLithuaniaLow & middle incomeLow incomeLower middle incomeLuxembourgMacao SAR, ChinaMacedonia, FYRMadagascarMalawiMalaysiaMaldivesMaliMaltaMarshall IslandsMauritaniaMauritiusMexicoMiddle East & North AfricaMiddle East & North Africa (excluding high income)Middle East & North Africa (IDA & IBRD countries)Middle incomeMoldovaMonacoMongoliaMoroccoMozambiqueMyanmarNamibiaNauruNepalNetherlandsNew ZealandNicaraguaNigerNigeriaNorth AmericaNorwayOECD membersOmanOther small statesPacific island small statesPakistanPalauPanamaPapua New GuineaParaguayPeruPhilippinesPolandPortugalPost-demographic dividendPre-demographic dividendPuerto RicoQatarRomaniaRussian FederationRwandaSamoaSan MarinoSao Tome and PrincipeSaudi ArabiaSenegalSerbiaSeychellesSierra LeoneSingaporeSlovak RepublicSloveniaSmall statesSolomon IslandsSomaliaSouth AfricaSouth AsiaSouth Asia (IDA & IBRD)SpainSri LankaSt. Kitts and NevisSt. LuciaSt. Vincent and the GrenadinesSub-Saharan Africa Sub-Saharan Africa (excluding high income)Sub-Saharan Africa (IDA & IBRD countries)SudanSurinameSwazilandSwedenSwitzerlandSyrian Arab RepublicTajikistanTanzaniaThailandTimor-LesteTogoTongaTrinidad and TobagoTunisiaTurkeyTurks and Caicos IslandsTuvaluUgandaUkraineUnited Arab EmiratesUnited KingdomUnited StatesUpper middle incomeUruguayVanuatuVenezuela, RBVietnamWest Bank and GazaWorldYemen, Rep.ZambiaZimbabwe Timeline:
This timeline shows a graph from 1971 to 2015 of Brunei Darussalam. No data until 1970. Number of actual observations by date: 40.
Source name:
World Development Indicators
Source organization:
UNESCO Institute for Statistics
Categories, topics:
Education
Last updated:
apr 23, 2017
Indicators value changes by year
Minimum:
22.581
jan 1, 1975
Maximum:
39.233
jan 1, 2015
At the date of observation
Value
Absolute change
Change from previous value
jan 1, 1971
26.105
+26.105
0.0%
jan 1, 1972
25.115
-0.99
-3.79%
jan 1, 1973
24.494
-0.62
-2.47%
jan 1, 1974
23.586
-0.908
-3.71%
jan 1, 1975
22.581
-1.005
-4.26%
jan 1, 1976
22.787
+0.206
0.91%
jan 1, 1977
24.286
+1.499
6.58%
jan 1, 1981
28.506
+4.22
17.37%
jan 1, 1982
29.769
+1.263
4.43%
jan 1, 1983
30.023
+0.254
0.85%
jan 1, 1984
31.464
+1.44
4.8%
jan 1, 1985
31.24
-0.224
-0.71%
jan 1, 1987
28.789
-2.451
-7.84%
jan 1, 1988
28.141
-0.648
-2.25%
jan 1, 1989
23.462
-4.678
-16.62%
jan 1, 1990
24.284
+0.821
3.5%
jan 1, 1992
25.362
+1.078
4.44%
jan 1, 1993
26.394
+1.032
4.07%
jan 1, 1994
28.643
+2.249
8.52%
jan 1, 1995
29.775
+1.132
3.95%
jan 1, 1996
31.751
+1.976
6.64%
jan 1, 1997
33.185
+1.433
4.51%
jan 1, 1998
34.474
+1.289
3.89%
jan 1, 1999
35.537
+1.063
3.08%
jan 1, 2000
36.009
+0.472
1.33%
jan 1, 2001
35.099
-0.91
-2.53%
jan 1, 2002
33.767
-1.332
-3.8%
jan 1, 2003
34.809
+1.042
3.09%
jan 1, 2004
35.879
+1.07
3.07%
jan 1, 2005
35.943
+0.064
0.18%
jan 1, 2006
35.719
-0.224
-0.62%
jan 1, 2007
36.382
+0.663
1.86%
jan 1, 2008
36.503
+0.121
0.33%
jan 1, 2009
37.292
+0.789
2.16%
jan 1, 2010
36.707
-0.585
-1.57%
jan 1, 2011
36.411
-0.296
-0.81%
jan 1, 2012
36.612
+0.201
0.55%
jan 1, 2013
37.27
+0.658
1.8%
jan 1, 2014
38.216
+0.946
2.54%
jan 1, 2015
39.233
+1.017
2.66%
Ranking of countries by current statistics by years


Comments: