29
/
en
AIzaSyAYiBZKx7MnpbEhh9jyipgxe19OcubqV5w
April 1, 2024
36889
IBRD only
IBD
false
2
1
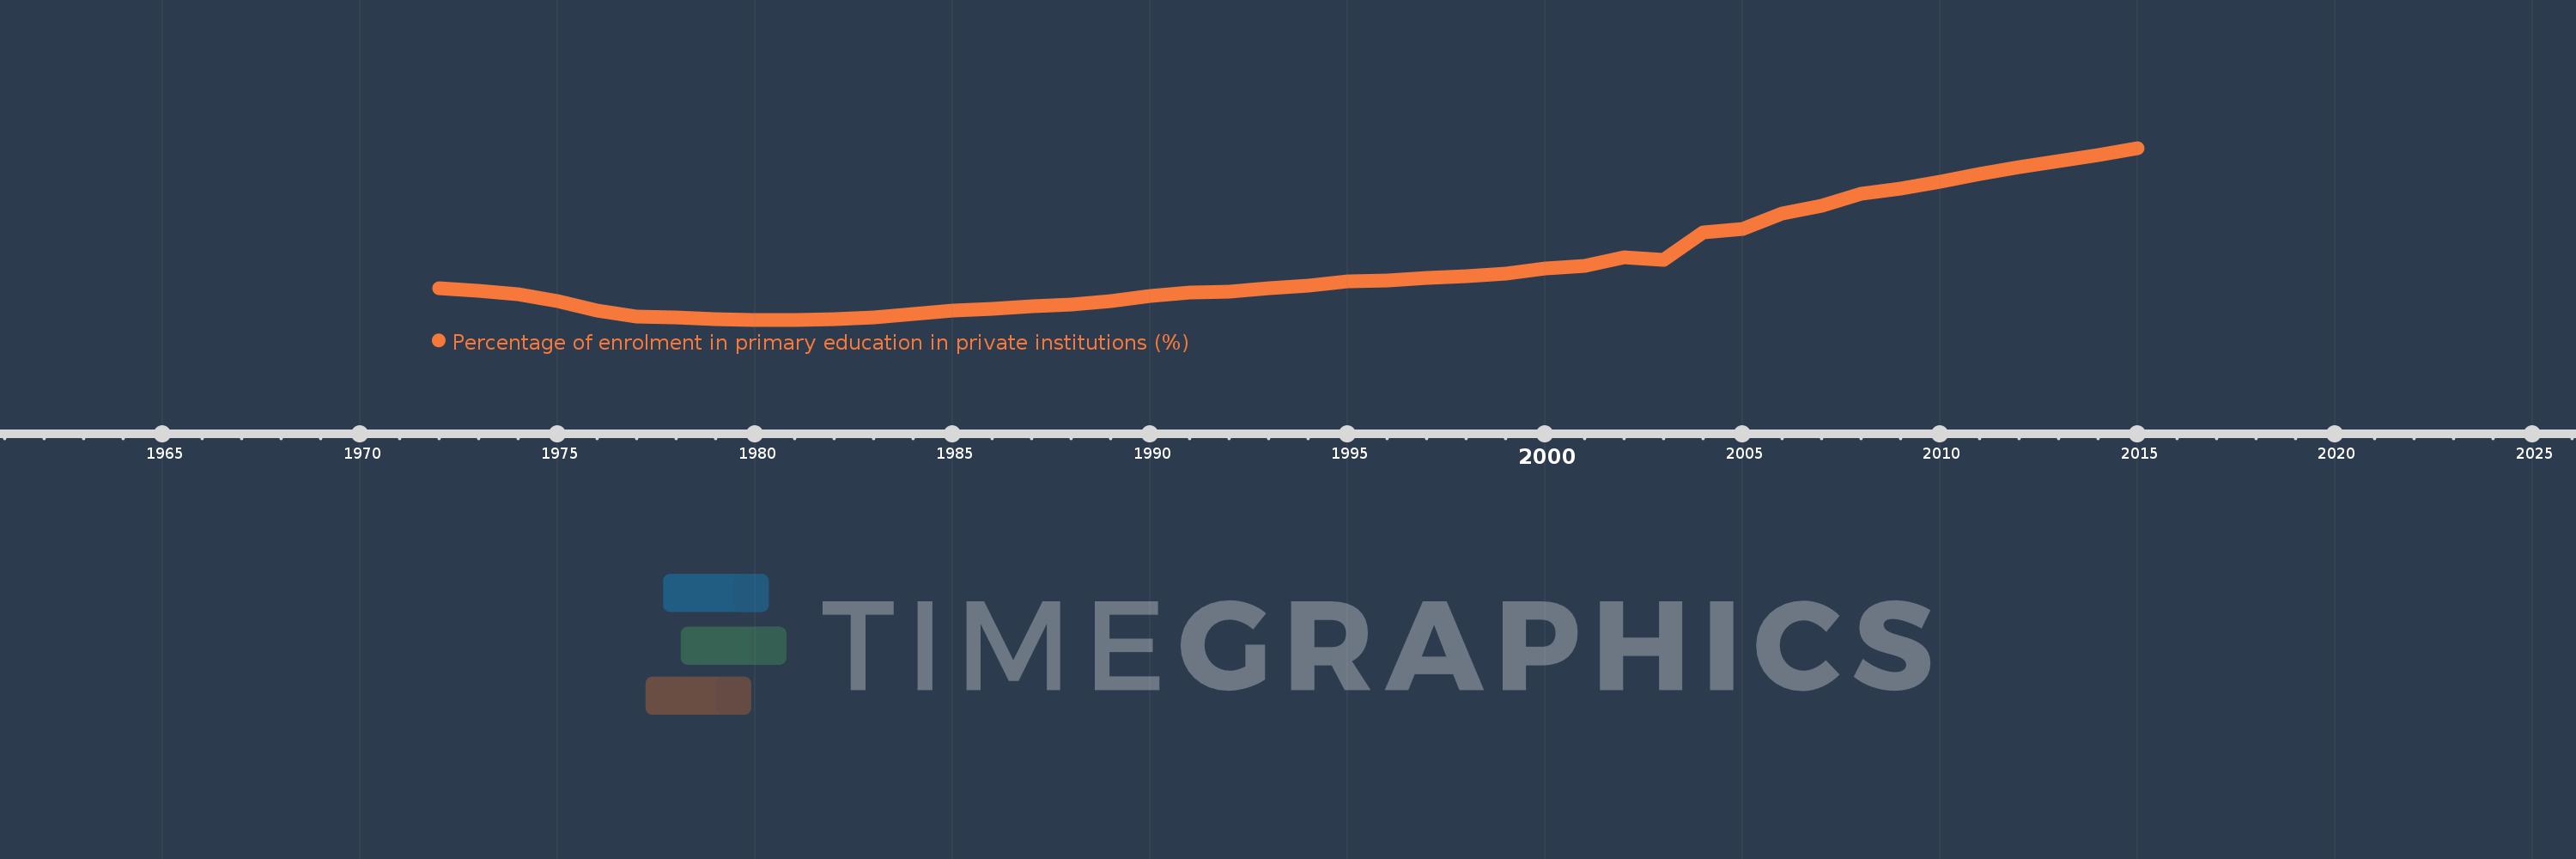
Percentage of enrolment in primary education in private institutions (%)
2015,2014,2013,2012,2011,2010,2009,2008,2007,2006,2005,2004,2003,2002,2001,2000,1999,1998,1997,1996,1995,1994,1993,1992,1991,1990,1989,1988,1987,1986,1985,1984,1983,1982,1981,1980,1979,1978,1977,1976,1975,1974,1973,1972
This statistics in other country:
AfghanistanAlbaniaAlgeriaAndorraAngolaAntigua and BarbudaArab WorldArgentinaArmeniaArubaAustraliaAustriaAzerbaijanBahamas, TheBahrainBangladeshBarbadosBelarusBelgiumBelizeBeninBermudaBhutanBoliviaBosnia and HerzegovinaBotswanaBrazilBritish Virgin IslandsBrunei DarussalamBulgariaBurkina FasoBurundiCabo VerdeCambodiaCameroonCanadaCaribbean small statesCayman IslandsCentral African RepublicCentral Europe and the BalticsChadChileChinaColombiaComorosCongo, Dem. Rep.Congo, Rep.Costa RicaCote d'IvoireCroatiaCubaCuracaoCyprusCzech RepublicDenmarkDjiboutiDominicaDominican RepublicEarly-demographic dividendEast Asia & PacificEast Asia & Pacific (excluding high income)East Asia & Pacific (IDA & IBRD countries)EcuadorEgypt, Arab Rep.El SalvadorEquatorial GuineaEritreaEstoniaEthiopiaEuro areaEurope & Central AsiaEurope & Central Asia (excluding high income)Europe & Central Asia (IDA & IBRD countries)European UnionFijiFinlandFragile and conflict affected situationsFranceGabonGambia, TheGeorgiaGermanyGhanaGibraltarGreeceGrenadaGuatemalaGuineaGuinea-BissauGuyanaHaitiHeavily indebted poor countries (HIPC)High incomeHondurasHong Kong SAR, ChinaHungaryIBRD onlyIcelandIDA & IBRD totalIDA blendIDA onlyIDA totalIndiaIndonesiaIran, Islamic Rep.IraqIrelandIsraelItalyJamaicaJapanJordanKazakhstanKenyaKiribatiKorea, Rep.KuwaitKyrgyz RepublicLao PDRLate-demographic dividendLatin America & Caribbean Latin America & Caribbean (excluding high income)Latin America & the Caribbean (IDA & IBRD countries)LatviaLeast developed countries: UN classificationLebanonLesothoLiberiaLibyaLiechtensteinLithuaniaLow & middle incomeLow incomeLower middle incomeLuxembourgMacao SAR, ChinaMacedonia, FYRMadagascarMalawiMalaysiaMaldivesMaliMaltaMarshall IslandsMauritaniaMauritiusMexicoMiddle East & North AfricaMiddle East & North Africa (excluding high income)Middle East & North Africa (IDA & IBRD countries)Middle incomeMoldovaMonacoMongoliaMoroccoMozambiqueMyanmarNamibiaNauruNepalNetherlandsNew ZealandNicaraguaNigerNigeriaNorth AmericaNorwayOECD membersOmanOther small statesPacific island small statesPakistanPalauPanamaPapua New GuineaParaguayPeruPhilippinesPolandPortugalPost-demographic dividendPre-demographic dividendPuerto RicoQatarRomaniaRussian FederationRwandaSamoaSan MarinoSao Tome and PrincipeSaudi ArabiaSenegalSerbiaSeychellesSierra LeoneSingaporeSlovak RepublicSloveniaSmall statesSolomon IslandsSomaliaSouth AfricaSouth AsiaSouth Asia (IDA & IBRD)SpainSri LankaSt. Kitts and NevisSt. LuciaSt. Vincent and the GrenadinesSub-Saharan Africa Sub-Saharan Africa (excluding high income)Sub-Saharan Africa (IDA & IBRD countries)SudanSurinameSwazilandSwedenSwitzerlandSyrian Arab RepublicTajikistanTanzaniaThailandTimor-LesteTogoTongaTrinidad and TobagoTunisiaTurkeyTurks and Caicos IslandsTuvaluUgandaUkraineUnited Arab EmiratesUnited KingdomUnited StatesUpper middle incomeUruguayVanuatuVenezuela, RBVietnamWest Bank and GazaWorldYemen, Rep.ZambiaZimbabwe Timeline:
This timeline shows a graph from 1972 to 2015 of IBRD only. No data until 1971. Number of actual observations by date: 44.
Source name:
World Development Indicators
Source organization:
UNESCO Institute for Statistics
Categories, topics:
Education
Last updated:
apr 23, 2017
Indicators value changes by year
At the date of observation
Value
Absolute change
Change from previous value
jan 1, 1972
8.02
+8.02
0.0%
jan 1, 1973
7.931
-0.09
-1.12%
jan 1, 1974
7.798
-0.133
-1.67%
jan 1, 1975
7.586
-0.212
-2.71%
jan 1, 1976
7.269
-0.317
-4.18%
jan 1, 1977
7.088
-0.181
-2.49%
jan 1, 1978
7.036
-0.052
-0.74%
jan 1, 1979
6.995
-0.041
-0.58%
jan 1, 1980
6.973
-0.022
-0.31%
jan 1, 1981
6.973
0.0
-0.01%
jan 1, 1982
7.001
+0.028
0.4%
jan 1, 1983
7.062
+0.062
0.88%
jan 1, 1984
7.162
+0.1
1.41%
jan 1, 1985
7.286
+0.124
1.72%
jan 1, 1986
7.323
+0.037
0.51%
jan 1, 1987
7.418
+0.095
1.29%
jan 1, 1988
7.462
+0.044
0.6%
jan 1, 1989
7.593
+0.131
1.76%
jan 1, 1990
7.76
+0.167
2.2%
jan 1, 1991
7.854
+0.093
1.2%
jan 1, 1992
7.903
+0.049
0.63%
jan 1, 1993
7.994
+0.091
1.15%
jan 1, 1994
8.106
+0.112
1.4%
jan 1, 1995
8.24
+0.135
1.66%
jan 1, 1996
8.266
+0.025
0.3%
jan 1, 1997
8.354
+0.088
1.07%
jan 1, 1998
8.406
+0.052
0.63%
jan 1, 1999
8.485
+0.079
0.94%
jan 1, 2000
8.656
+0.171
2.02%
jan 1, 2001
8.735
+0.079
0.91%
jan 1, 2002
9.012
+0.277
3.18%
jan 1, 2003
8.949
-0.063
-0.7%
jan 1, 2004
9.832
+0.882
9.86%
jan 1, 2005
9.966
+0.135
1.37%
jan 1, 2006
10.467
+0.501
5.02%
jan 1, 2007
10.721
+0.254
2.43%
jan 1, 2008
11.118
+0.396
3.7%
jan 1, 2009
11.278
+0.16
1.44%
jan 1, 2010
11.506
+0.229
2.03%
jan 1, 2011
11.745
+0.239
2.08%
jan 1, 2012
11.972
+0.227
1.93%
jan 1, 2013
12.174
+0.202
1.69%
jan 1, 2014
12.374
+0.2
1.65%
jan 1, 2015
12.61
+0.236
1.9%
Ranking of countries by current statistics by years


Comments: