29
/
en
AIzaSyAYiBZKx7MnpbEhh9jyipgxe19OcubqV5w
April 1, 2024
134471
France
FRA
true
2
1
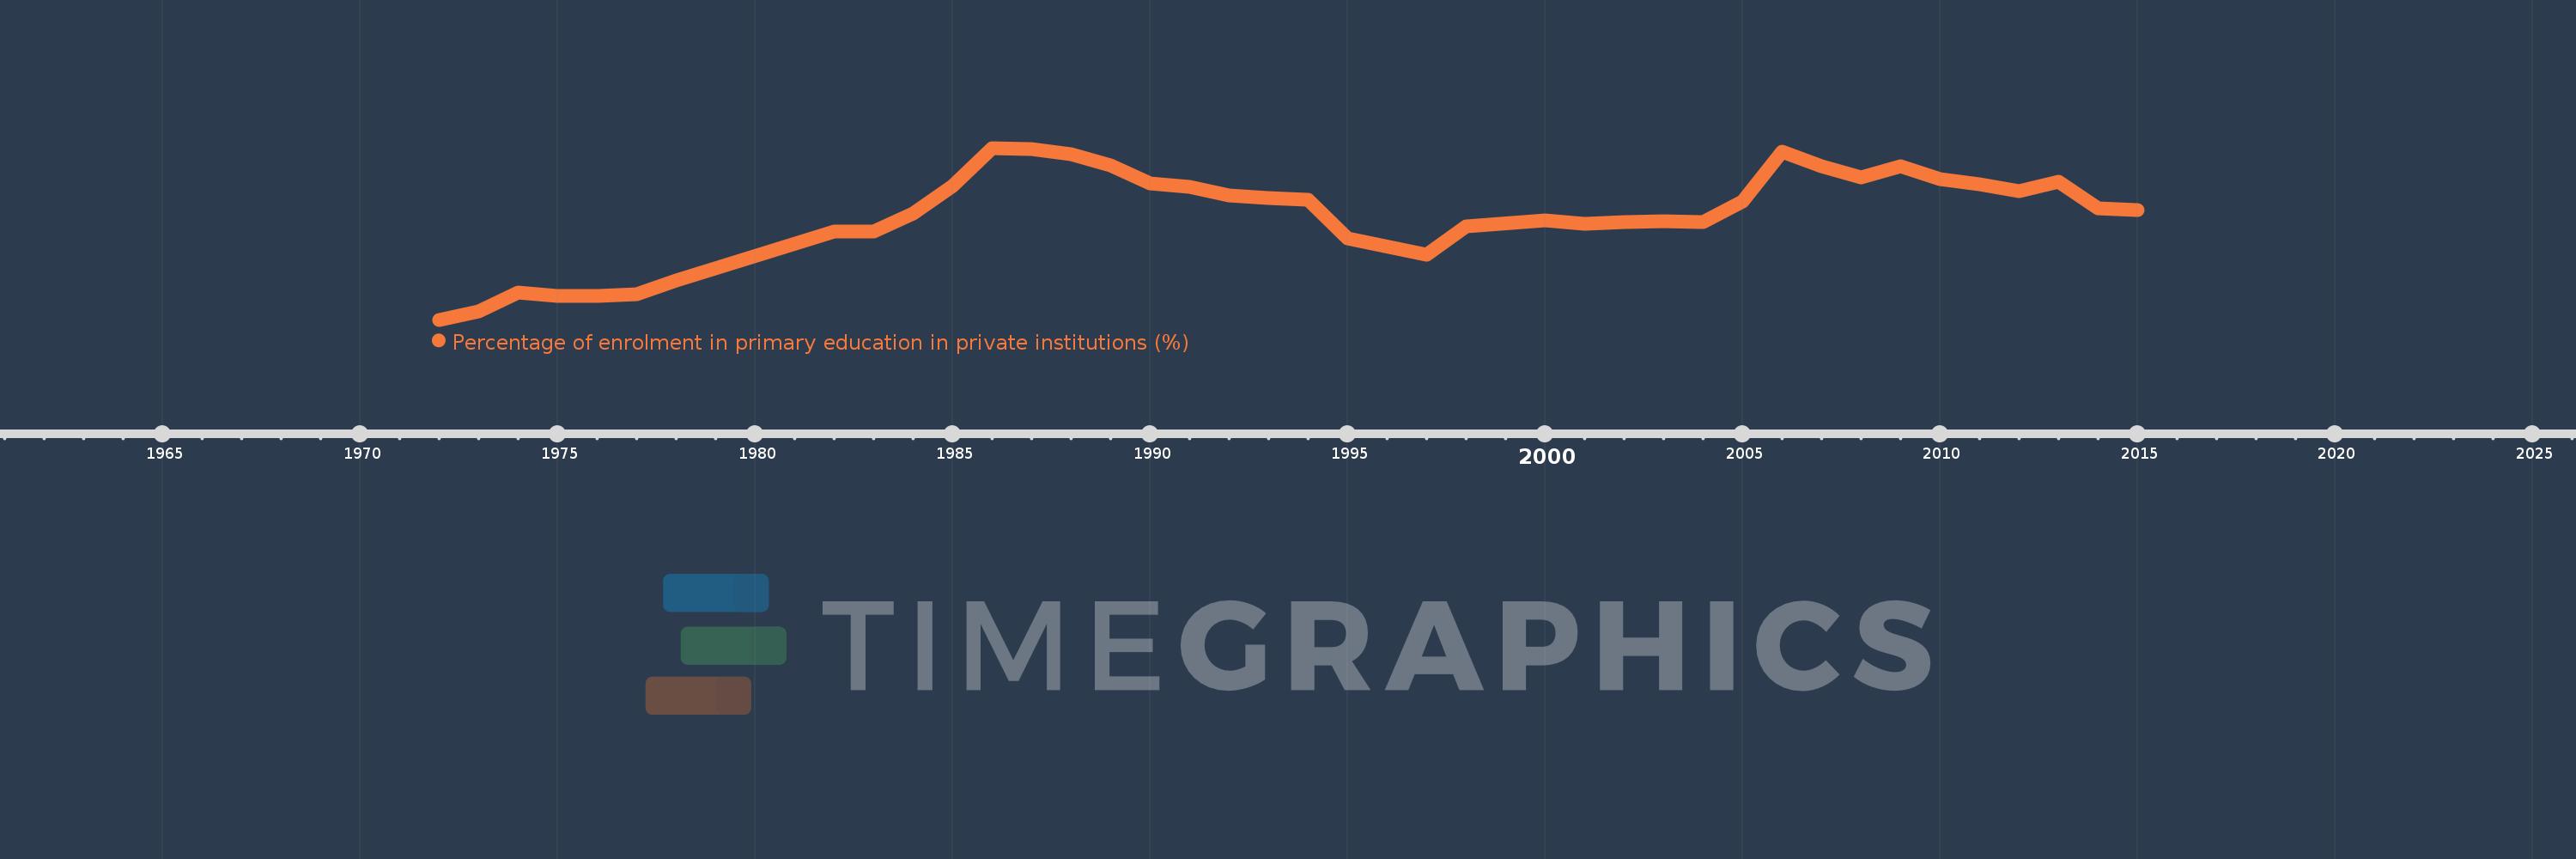
Percentage of enrolment in primary education in private institutions (%)
2015,2014,2013,2012,2011,2010,2009,2008,2007,2006,2005,2004,2003,2002,2001,2000,1998,1997,1995,1994,1993,1992,1991,1990,1989,1988,1987,1986,1985,1984,1983,1982,1978,1977,1976,1975,1974,1973,1972
This statistics in other country:
AfghanistanAlbaniaAlgeriaAndorraAngolaAntigua and BarbudaArab WorldArgentinaArmeniaArubaAustraliaAustriaAzerbaijanBahamas, TheBahrainBangladeshBarbadosBelarusBelgiumBelizeBeninBermudaBhutanBoliviaBosnia and HerzegovinaBotswanaBrazilBritish Virgin IslandsBrunei DarussalamBulgariaBurkina FasoBurundiCabo VerdeCambodiaCameroonCanadaCaribbean small statesCayman IslandsCentral African RepublicCentral Europe and the BalticsChadChileChinaColombiaComorosCongo, Dem. Rep.Congo, Rep.Costa RicaCote d'IvoireCroatiaCubaCuracaoCyprusCzech RepublicDenmarkDjiboutiDominicaDominican RepublicEarly-demographic dividendEast Asia & PacificEast Asia & Pacific (excluding high income)East Asia & Pacific (IDA & IBRD countries)EcuadorEgypt, Arab Rep.El SalvadorEquatorial GuineaEritreaEstoniaEthiopiaEuro areaEurope & Central AsiaEurope & Central Asia (excluding high income)Europe & Central Asia (IDA & IBRD countries)European UnionFijiFinlandFragile and conflict affected situationsFranceGabonGambia, TheGeorgiaGermanyGhanaGibraltarGreeceGrenadaGuatemalaGuineaGuinea-BissauGuyanaHaitiHeavily indebted poor countries (HIPC)High incomeHondurasHong Kong SAR, ChinaHungaryIBRD onlyIcelandIDA & IBRD totalIDA blendIDA onlyIDA totalIndiaIndonesiaIran, Islamic Rep.IraqIrelandIsraelItalyJamaicaJapanJordanKazakhstanKenyaKiribatiKorea, Rep.KuwaitKyrgyz RepublicLao PDRLate-demographic dividendLatin America & Caribbean Latin America & Caribbean (excluding high income)Latin America & the Caribbean (IDA & IBRD countries)LatviaLeast developed countries: UN classificationLebanonLesothoLiberiaLibyaLiechtensteinLithuaniaLow & middle incomeLow incomeLower middle incomeLuxembourgMacao SAR, ChinaMacedonia, FYRMadagascarMalawiMalaysiaMaldivesMaliMaltaMarshall IslandsMauritaniaMauritiusMexicoMiddle East & North AfricaMiddle East & North Africa (excluding high income)Middle East & North Africa (IDA & IBRD countries)Middle incomeMoldovaMonacoMongoliaMoroccoMozambiqueMyanmarNamibiaNauruNepalNetherlandsNew ZealandNicaraguaNigerNigeriaNorth AmericaNorwayOECD membersOmanOther small statesPacific island small statesPakistanPalauPanamaPapua New GuineaParaguayPeruPhilippinesPolandPortugalPost-demographic dividendPre-demographic dividendPuerto RicoQatarRomaniaRussian FederationRwandaSamoaSan MarinoSao Tome and PrincipeSaudi ArabiaSenegalSerbiaSeychellesSierra LeoneSingaporeSlovak RepublicSloveniaSmall statesSolomon IslandsSomaliaSouth AfricaSouth AsiaSouth Asia (IDA & IBRD)SpainSri LankaSt. Kitts and NevisSt. LuciaSt. Vincent and the GrenadinesSub-Saharan Africa Sub-Saharan Africa (excluding high income)Sub-Saharan Africa (IDA & IBRD countries)SudanSurinameSwazilandSwedenSwitzerlandSyrian Arab RepublicTajikistanTanzaniaThailandTimor-LesteTogoTongaTrinidad and TobagoTunisiaTurkeyTurks and Caicos IslandsTuvaluUgandaUkraineUnited Arab EmiratesUnited KingdomUnited StatesUpper middle incomeUruguayVanuatuVenezuela, RBVietnamWest Bank and GazaWorldYemen, Rep.ZambiaZimbabwe Timeline:
This timeline shows a graph from 1972 to 2015 of France. No data until 1971. Number of actual observations by date: 39.
Source name:
World Development Indicators
Source organization:
UNESCO Institute for Statistics
Categories, topics:
Education
Last updated:
apr 23, 2017
Indicators value changes by year
Maximum:
15.079
jan 1, 1986
At the date of observation
Value
Absolute change
Change from previous value
jan 1, 1972
13.89
+13.89
0.0%
jan 1, 1973
13.946
+0.056
0.4%
jan 1, 1974
14.08
+0.134
0.96%
jan 1, 1975
14.057
-0.023
-0.16%
jan 1, 1976
14.054
-0.003
-0.02%
jan 1, 1977
14.069
+0.015
0.11%
jan 1, 1978
14.159
+0.09
0.64%
jan 1, 1982
14.503
+0.344
2.43%
jan 1, 1983
14.498
-0.005
-0.03%
jan 1, 1984
14.623
+0.125
0.86%
jan 1, 1985
14.817
+0.194
1.33%
jan 1, 1986
15.079
+0.262
1.77%
jan 1, 1987
15.071
-0.008
-0.05%
jan 1, 1988
15.033
-0.037
-0.25%
jan 1, 1989
14.96
-0.073
-0.49%
jan 1, 1990
14.832
-0.128
-0.86%
jan 1, 1991
14.811
-0.021
-0.14%
jan 1, 1992
14.751
-0.06
-0.4%
jan 1, 1993
14.734
-0.017
-0.11%
jan 1, 1994
14.718
-0.016
-0.11%
jan 1, 1995
14.452
-0.266
-1.81%
jan 1, 1997
14.343
-0.108
-0.75%
jan 1, 1998
14.536
+0.193
1.35%
jan 1, 2000
14.576
+0.04
0.27%
jan 1, 2001
14.556
-0.02
-0.14%
jan 1, 2002
14.568
+0.012
0.08%
jan 1, 2003
14.569
+0.0
0.0%
jan 1, 2004
14.564
-0.005
-0.03%
jan 1, 2005
14.71
+0.146
1.0%
jan 1, 2006
15.054
+0.344
2.34%
jan 1, 2007
14.95
-0.104
-0.69%
jan 1, 2008
14.875
-0.075
-0.5%
jan 1, 2009
14.955
+0.08
0.54%
jan 1, 2010
14.865
-0.09
-0.6%
jan 1, 2011
14.827
-0.038
-0.26%
jan 1, 2012
14.778
-0.049
-0.33%
jan 1, 2013
14.843
+0.065
0.44%
jan 1, 2014
14.661
-0.182
-1.23%
jan 1, 2015
14.652
-0.009
-0.06%
Ranking of countries by current statistics by years


Comments: