29
/
en
AIzaSyAYiBZKx7MnpbEhh9jyipgxe19OcubqV5w
April 1, 2024
40967
Late-demographic dividend
LTE
false
2
1
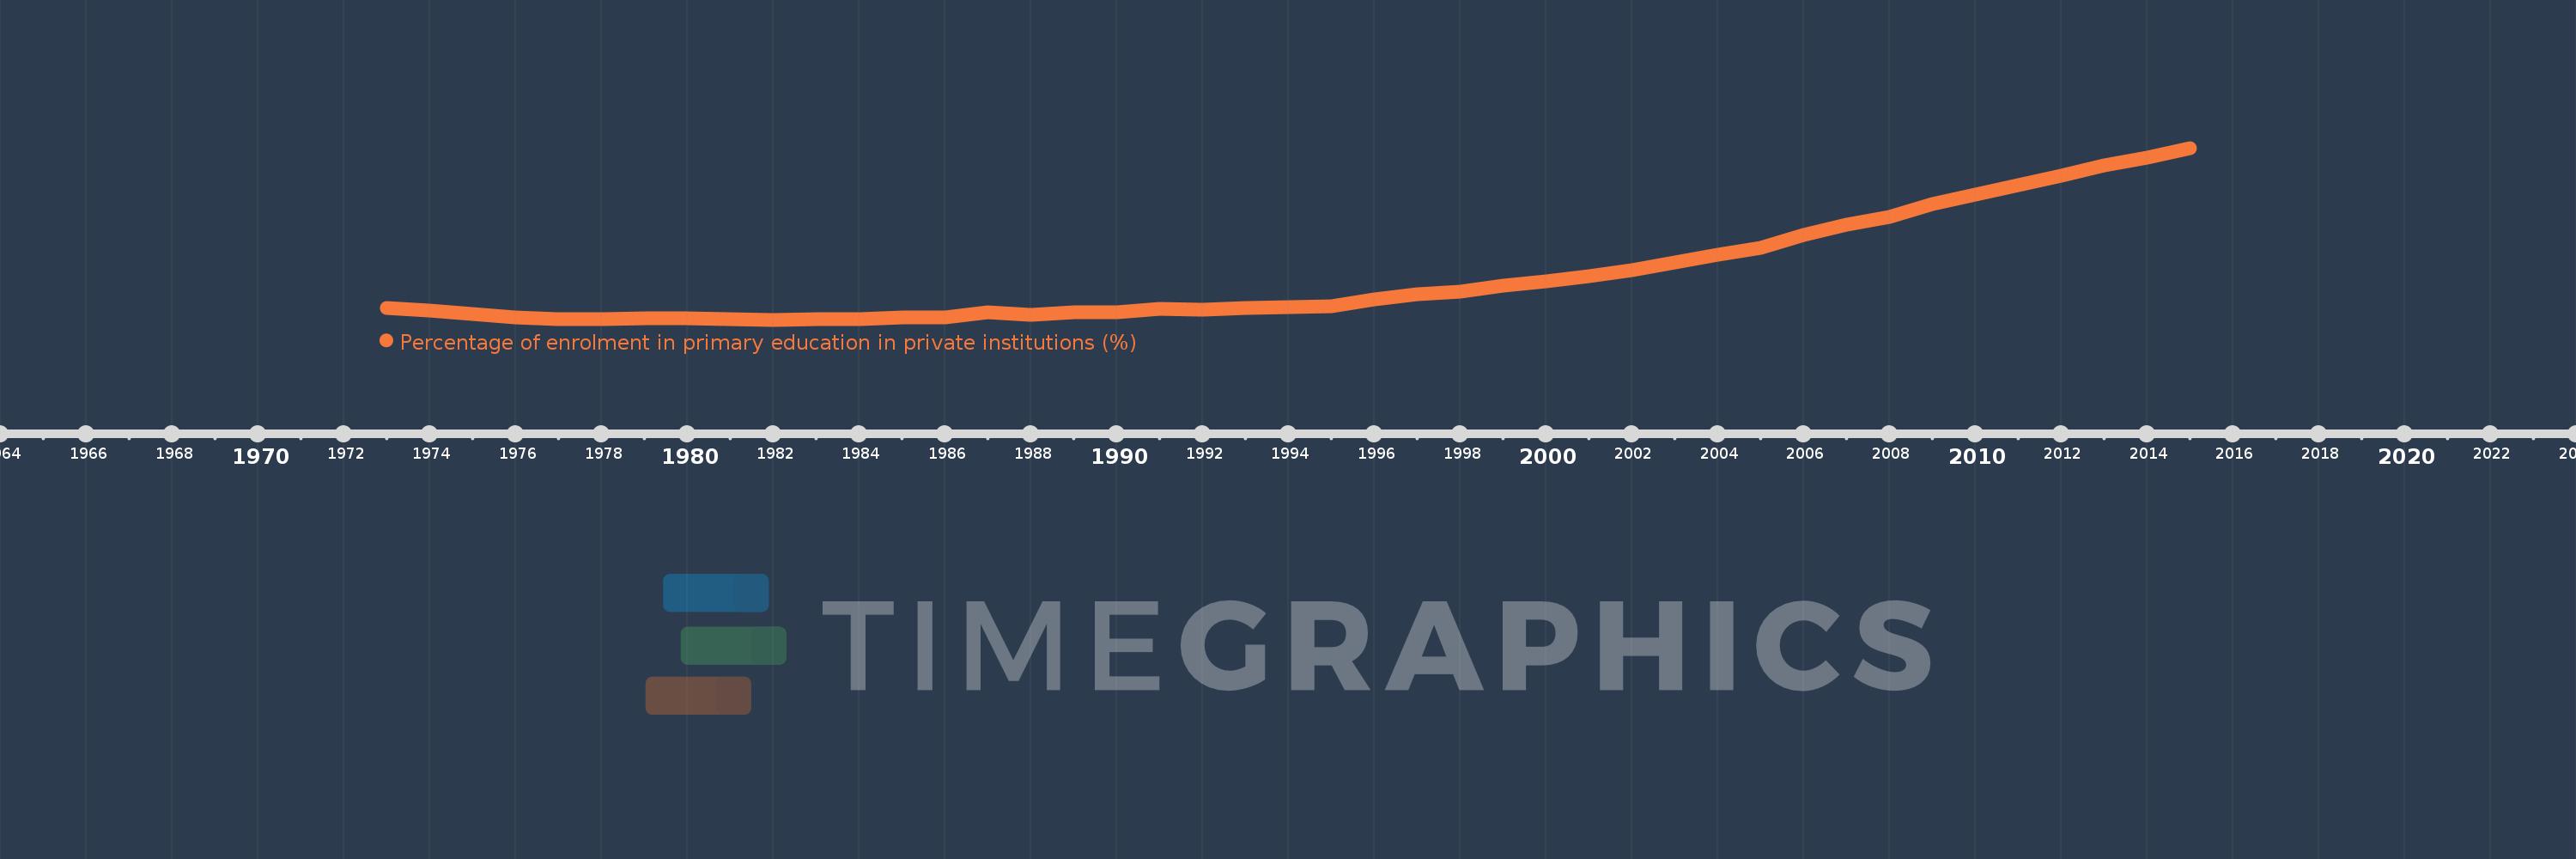
Percentage of enrolment in primary education in private institutions (%)
2015,2014,2013,2012,2011,2010,2009,2008,2007,2006,2005,2004,2003,2002,2001,2000,1999,1998,1997,1996,1995,1994,1993,1992,1991,1990,1989,1988,1987,1986,1985,1984,1983,1982,1981,1980,1979,1978,1977,1976,1975,1974,1973
This statistics in other country:
AfghanistanAlbaniaAlgeriaAndorraAngolaAntigua and BarbudaArab WorldArgentinaArmeniaArubaAustraliaAustriaAzerbaijanBahamas, TheBahrainBangladeshBarbadosBelarusBelgiumBelizeBeninBermudaBhutanBoliviaBosnia and HerzegovinaBotswanaBrazilBritish Virgin IslandsBrunei DarussalamBulgariaBurkina FasoBurundiCabo VerdeCambodiaCameroonCanadaCaribbean small statesCayman IslandsCentral African RepublicCentral Europe and the BalticsChadChileChinaColombiaComorosCongo, Dem. Rep.Congo, Rep.Costa RicaCote d'IvoireCroatiaCubaCuracaoCyprusCzech RepublicDenmarkDjiboutiDominicaDominican RepublicEarly-demographic dividendEast Asia & PacificEast Asia & Pacific (excluding high income)East Asia & Pacific (IDA & IBRD countries)EcuadorEgypt, Arab Rep.El SalvadorEquatorial GuineaEritreaEstoniaEthiopiaEuro areaEurope & Central AsiaEurope & Central Asia (excluding high income)Europe & Central Asia (IDA & IBRD countries)European UnionFijiFinlandFragile and conflict affected situationsFranceGabonGambia, TheGeorgiaGermanyGhanaGibraltarGreeceGrenadaGuatemalaGuineaGuinea-BissauGuyanaHaitiHeavily indebted poor countries (HIPC)High incomeHondurasHong Kong SAR, ChinaHungaryIBRD onlyIcelandIDA & IBRD totalIDA blendIDA onlyIDA totalIndiaIndonesiaIran, Islamic Rep.IraqIrelandIsraelItalyJamaicaJapanJordanKazakhstanKenyaKiribatiKorea, Rep.KuwaitKyrgyz RepublicLao PDRLate-demographic dividendLatin America & Caribbean Latin America & Caribbean (excluding high income)Latin America & the Caribbean (IDA & IBRD countries)LatviaLeast developed countries: UN classificationLebanonLesothoLiberiaLibyaLiechtensteinLithuaniaLow & middle incomeLow incomeLower middle incomeLuxembourgMacao SAR, ChinaMacedonia, FYRMadagascarMalawiMalaysiaMaldivesMaliMaltaMarshall IslandsMauritaniaMauritiusMexicoMiddle East & North AfricaMiddle East & North Africa (excluding high income)Middle East & North Africa (IDA & IBRD countries)Middle incomeMoldovaMonacoMongoliaMoroccoMozambiqueMyanmarNamibiaNauruNepalNetherlandsNew ZealandNicaraguaNigerNigeriaNorth AmericaNorwayOECD membersOmanOther small statesPacific island small statesPakistanPalauPanamaPapua New GuineaParaguayPeruPhilippinesPolandPortugalPost-demographic dividendPre-demographic dividendPuerto RicoQatarRomaniaRussian FederationRwandaSamoaSan MarinoSao Tome and PrincipeSaudi ArabiaSenegalSerbiaSeychellesSierra LeoneSingaporeSlovak RepublicSloveniaSmall statesSolomon IslandsSomaliaSouth AfricaSouth AsiaSouth Asia (IDA & IBRD)SpainSri LankaSt. Kitts and NevisSt. LuciaSt. Vincent and the GrenadinesSub-Saharan Africa Sub-Saharan Africa (excluding high income)Sub-Saharan Africa (IDA & IBRD countries)SudanSurinameSwazilandSwedenSwitzerlandSyrian Arab RepublicTajikistanTanzaniaThailandTimor-LesteTogoTongaTrinidad and TobagoTunisiaTurkeyTurks and Caicos IslandsTuvaluUgandaUkraineUnited Arab EmiratesUnited KingdomUnited StatesUpper middle incomeUruguayVanuatuVenezuela, RBVietnamWest Bank and GazaWorldYemen, Rep.ZambiaZimbabwe Timeline:
This timeline shows a graph from 1973 to 2015 of Late-demographic dividend. No data until 1972. Number of actual observations by date: 43.
Source name:
World Development Indicators
Source organization:
UNESCO Institute for Statistics
Categories, topics:
Education
Last updated:
apr 23, 2017
Indicators value changes by year
At the date of observation
Value
Absolute change
Change from previous value
jan 1, 1973
2.474
+2.474
0.0%
jan 1, 1974
2.391
-0.083
-3.37%
jan 1, 1975
2.244
-0.147
-6.16%
jan 1, 1976
2.108
-0.136
-6.04%
jan 1, 1977
2.015
-0.093
-4.4%
jan 1, 1978
2.016
+0.0
0.02%
jan 1, 1979
2.046
+0.031
1.52%
jan 1, 1980
2.041
-0.005
-0.24%
jan 1, 1981
2.011
-0.03
-1.49%
jan 1, 1982
1.995
-0.015
-0.76%
jan 1, 1983
2.012
+0.017
0.83%
jan 1, 1984
2.029
+0.017
0.84%
jan 1, 1985
2.097
+0.068
3.34%
jan 1, 1986
2.096
-0.001
-0.06%
jan 1, 1987
2.289
+0.193
9.22%
jan 1, 1988
2.213
-0.076
-3.33%
jan 1, 1989
2.291
+0.078
3.52%
jan 1, 1990
2.32
+0.03
1.29%
jan 1, 1991
2.43
+0.11
4.73%
jan 1, 1992
2.402
-0.028
-1.16%
jan 1, 1993
2.487
+0.085
3.53%
jan 1, 1994
2.51
+0.024
0.95%
jan 1, 1995
2.567
+0.056
2.25%
jan 1, 1996
2.826
+0.259
10.11%
jan 1, 1997
3.037
+0.211
7.45%
jan 1, 1998
3.141
+0.104
3.42%
jan 1, 1999
3.407
+0.266
8.47%
jan 1, 2000
3.591
+0.185
5.42%
jan 1, 2001
3.798
+0.207
5.77%
jan 1, 2002
4.059
+0.26
6.85%
jan 1, 2003
4.364
+0.305
7.52%
jan 1, 2004
4.683
+0.32
7.32%
jan 1, 2005
4.972
+0.289
6.16%
jan 1, 2006
5.503
+0.532
10.69%
jan 1, 2007
5.923
+0.42
7.63%
jan 1, 2008
6.266
+0.343
5.79%
jan 1, 2009
6.794
+0.528
8.43%
jan 1, 2010
7.179
+0.385
5.66%
jan 1, 2011
7.556
+0.377
5.26%
jan 1, 2012
7.975
+0.419
5.55%
jan 1, 2013
8.371
+0.396
4.97%
jan 1, 2014
8.707
+0.336
4.01%
jan 1, 2015
9.109
+0.402
4.61%
Ranking of countries by current statistics by years


Comments: