29
/
en
AIzaSyAYiBZKx7MnpbEhh9jyipgxe19OcubqV5w
April 1, 2024
41796
Latin America & Caribbean
LCN
false
2
1
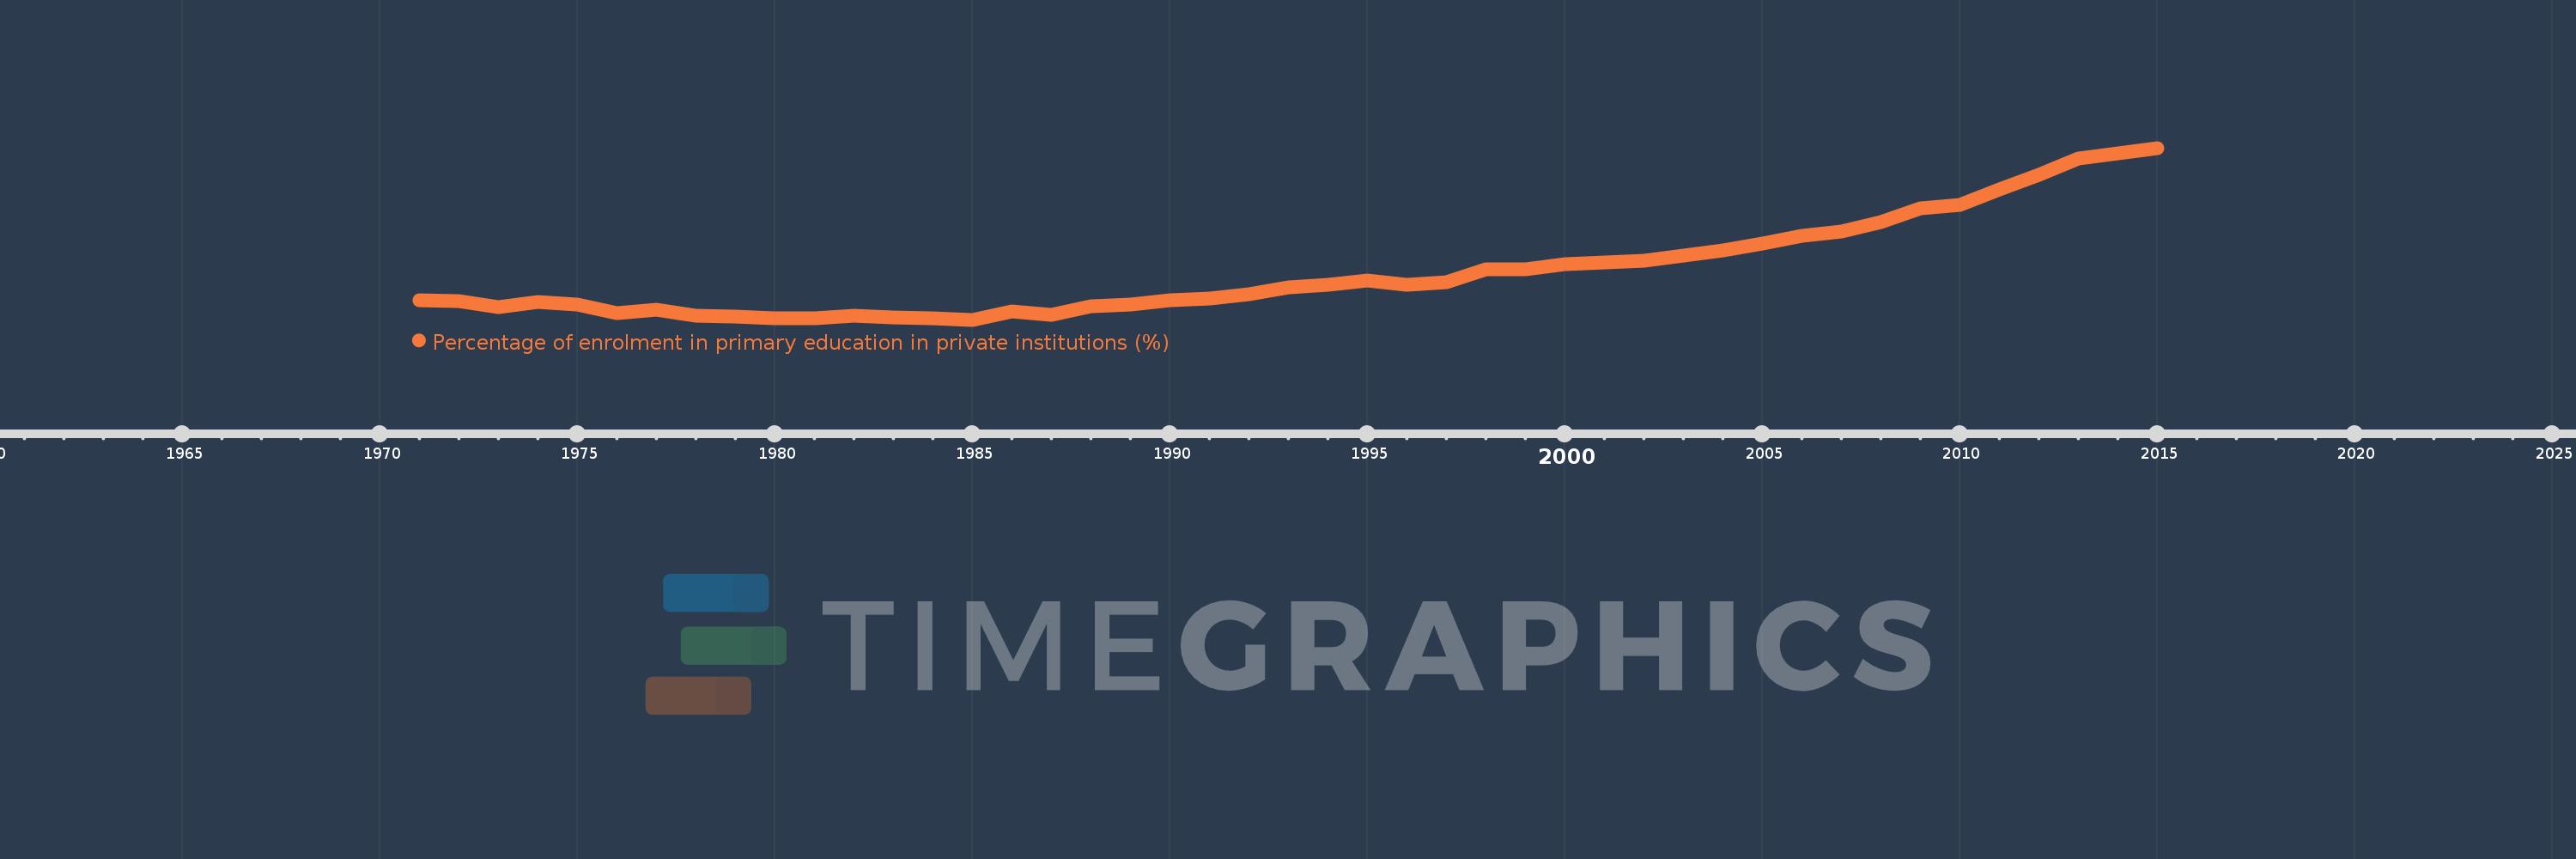
Percentage of enrolment in primary education in private institutions (%)
2015,2014,2013,2012,2011,2010,2009,2008,2007,2006,2005,2004,2003,2002,2001,2000,1999,1998,1997,1996,1995,1994,1993,1992,1991,1990,1989,1988,1987,1986,1985,1984,1983,1982,1981,1980,1979,1978,1977,1976,1975,1974,1973,1972,1971
This statistics in other country:
AfghanistanAlbaniaAlgeriaAndorraAngolaAntigua and BarbudaArab WorldArgentinaArmeniaArubaAustraliaAustriaAzerbaijanBahamas, TheBahrainBangladeshBarbadosBelarusBelgiumBelizeBeninBermudaBhutanBoliviaBosnia and HerzegovinaBotswanaBrazilBritish Virgin IslandsBrunei DarussalamBulgariaBurkina FasoBurundiCabo VerdeCambodiaCameroonCanadaCaribbean small statesCayman IslandsCentral African RepublicCentral Europe and the BalticsChadChileChinaColombiaComorosCongo, Dem. Rep.Congo, Rep.Costa RicaCote d'IvoireCroatiaCubaCuracaoCyprusCzech RepublicDenmarkDjiboutiDominicaDominican RepublicEarly-demographic dividendEast Asia & PacificEast Asia & Pacific (excluding high income)East Asia & Pacific (IDA & IBRD countries)EcuadorEgypt, Arab Rep.El SalvadorEquatorial GuineaEritreaEstoniaEthiopiaEuro areaEurope & Central AsiaEurope & Central Asia (excluding high income)Europe & Central Asia (IDA & IBRD countries)European UnionFijiFinlandFragile and conflict affected situationsFranceGabonGambia, TheGeorgiaGermanyGhanaGibraltarGreeceGrenadaGuatemalaGuineaGuinea-BissauGuyanaHaitiHeavily indebted poor countries (HIPC)High incomeHondurasHong Kong SAR, ChinaHungaryIBRD onlyIcelandIDA & IBRD totalIDA blendIDA onlyIDA totalIndiaIndonesiaIran, Islamic Rep.IraqIrelandIsraelItalyJamaicaJapanJordanKazakhstanKenyaKiribatiKorea, Rep.KuwaitKyrgyz RepublicLao PDRLate-demographic dividendLatin America & Caribbean Latin America & Caribbean (excluding high income)Latin America & the Caribbean (IDA & IBRD countries)LatviaLeast developed countries: UN classificationLebanonLesothoLiberiaLibyaLiechtensteinLithuaniaLow & middle incomeLow incomeLower middle incomeLuxembourgMacao SAR, ChinaMacedonia, FYRMadagascarMalawiMalaysiaMaldivesMaliMaltaMarshall IslandsMauritaniaMauritiusMexicoMiddle East & North AfricaMiddle East & North Africa (excluding high income)Middle East & North Africa (IDA & IBRD countries)Middle incomeMoldovaMonacoMongoliaMoroccoMozambiqueMyanmarNamibiaNauruNepalNetherlandsNew ZealandNicaraguaNigerNigeriaNorth AmericaNorwayOECD membersOmanOther small statesPacific island small statesPakistanPalauPanamaPapua New GuineaParaguayPeruPhilippinesPolandPortugalPost-demographic dividendPre-demographic dividendPuerto RicoQatarRomaniaRussian FederationRwandaSamoaSan MarinoSao Tome and PrincipeSaudi ArabiaSenegalSerbiaSeychellesSierra LeoneSingaporeSlovak RepublicSloveniaSmall statesSolomon IslandsSomaliaSouth AfricaSouth AsiaSouth Asia (IDA & IBRD)SpainSri LankaSt. Kitts and NevisSt. LuciaSt. Vincent and the GrenadinesSub-Saharan Africa Sub-Saharan Africa (excluding high income)Sub-Saharan Africa (IDA & IBRD countries)SudanSurinameSwazilandSwedenSwitzerlandSyrian Arab RepublicTajikistanTanzaniaThailandTimor-LesteTogoTongaTrinidad and TobagoTunisiaTurkeyTurks and Caicos IslandsTuvaluUgandaUkraineUnited Arab EmiratesUnited KingdomUnited StatesUpper middle incomeUruguayVanuatuVenezuela, RBVietnamWest Bank and GazaWorldYemen, Rep.ZambiaZimbabwe Timeline:
This timeline shows a graph from 1971 to 2015 of Latin America & Caribbean . No data until 1970. Number of actual observations by date: 45.
Source name:
World Development Indicators
Source organization:
UNESCO Institute for Statistics
Categories, topics:
Education
Last updated:
apr 23, 2017
Indicators value changes by year
Minimum:
11.397
jan 1, 1985
Maximum:
19.322
jan 1, 2015
At the date of observation
Value
Absolute change
Change from previous value
jan 1, 1971
12.304
+12.304
0.0%
jan 1, 1972
12.25
-0.054
-0.44%
jan 1, 1973
11.98
-0.271
-2.21%
jan 1, 1974
12.222
+0.243
2.03%
jan 1, 1975
12.111
-0.111
-0.91%
jan 1, 1976
11.711
-0.4
-3.31%
jan 1, 1977
11.86
+0.15
1.28%
jan 1, 1978
11.591
-0.27
-2.27%
jan 1, 1979
11.562
-0.028
-0.25%
jan 1, 1980
11.476
-0.086
-0.74%
jan 1, 1981
11.47
-0.006
-0.05%
jan 1, 1982
11.574
+0.104
0.91%
jan 1, 1983
11.516
-0.058
-0.5%
jan 1, 1984
11.465
-0.051
-0.44%
jan 1, 1985
11.397
-0.068
-0.59%
jan 1, 1986
11.763
+0.366
3.21%
jan 1, 1987
11.634
-0.129
-1.1%
jan 1, 1988
12.001
+0.367
3.16%
jan 1, 1989
12.088
+0.087
0.72%
jan 1, 1990
12.283
+0.194
1.61%
jan 1, 1991
12.37
+0.088
0.71%
jan 1, 1992
12.578
+0.208
1.68%
jan 1, 1993
12.887
+0.309
2.45%
jan 1, 1994
13.005
+0.118
0.92%
jan 1, 1995
13.211
+0.206
1.58%
jan 1, 1996
12.991
-0.22
-1.67%
jan 1, 1997
13.123
+0.133
1.02%
jan 1, 1998
13.714
+0.591
4.5%
jan 1, 1999
13.72
+0.006
0.05%
jan 1, 2000
13.961
+0.241
1.76%
jan 1, 2001
14.026
+0.065
0.47%
jan 1, 2002
14.121
+0.094
0.67%
jan 1, 2003
14.369
+0.248
1.75%
jan 1, 2004
14.612
+0.243
1.69%
jan 1, 2005
14.928
+0.316
2.17%
jan 1, 2006
15.266
+0.338
2.26%
jan 1, 2007
15.474
+0.208
1.36%
jan 1, 2008
15.907
+0.433
2.8%
jan 1, 2009
16.555
+0.648
4.08%
jan 1, 2010
16.714
+0.159
0.96%
jan 1, 2011
17.39
+0.676
4.05%
jan 1, 2012
18.079
+0.689
3.96%
jan 1, 2013
18.836
+0.757
4.19%
jan 1, 2014
19.074
+0.238
1.26%
jan 1, 2015
19.322
+0.248
1.3%
Ranking of countries by current statistics by years


Comments: