29
/
en
AIzaSyAYiBZKx7MnpbEhh9jyipgxe19OcubqV5w
April 1, 2024
36070
High income
HIC
false
2
1
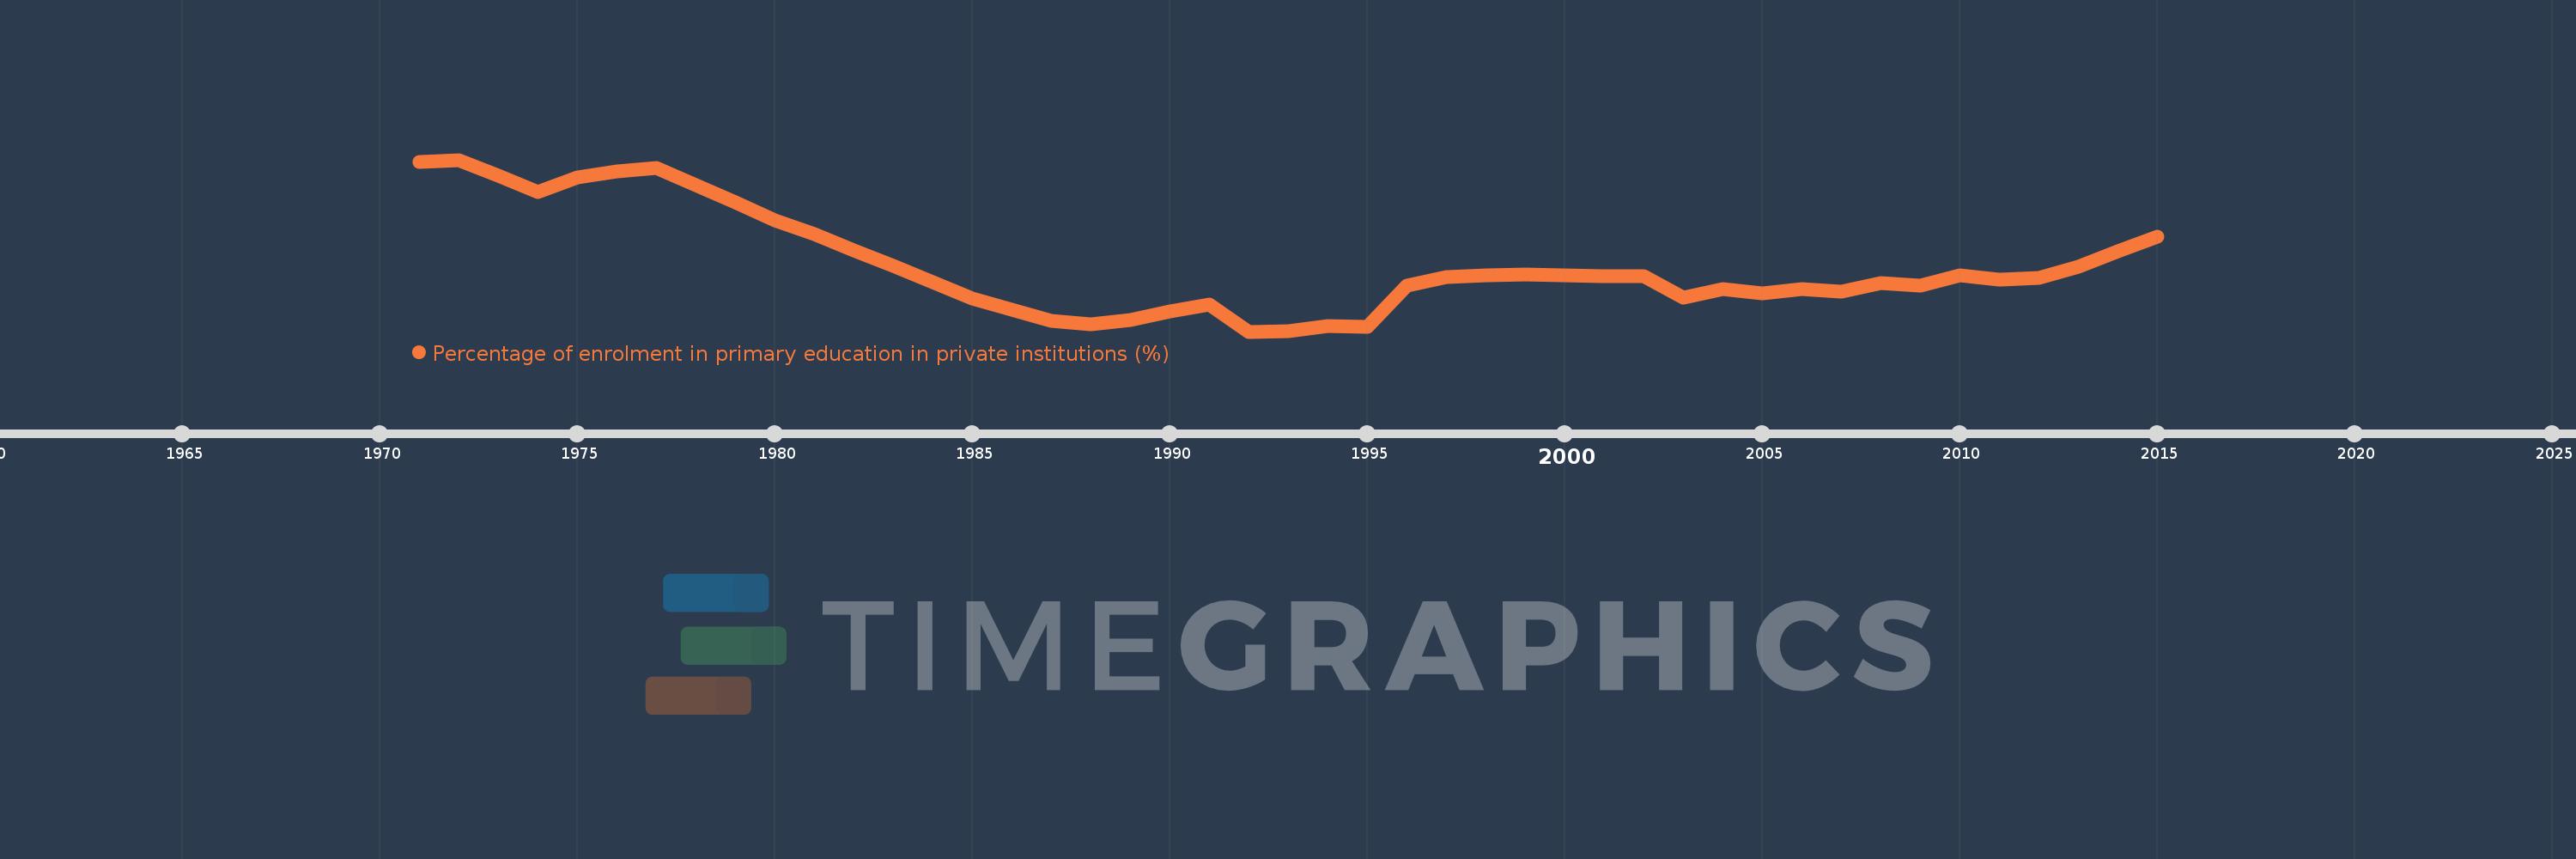
Percentage of enrolment in primary education in private institutions (%)
2015,2014,2013,2012,2011,2010,2009,2008,2007,2006,2005,2004,2003,2002,2001,2000,1999,1998,1997,1996,1995,1994,1993,1992,1991,1990,1989,1988,1987,1986,1985,1984,1983,1982,1981,1980,1979,1978,1977,1976,1975,1974,1973,1972,1971
This statistics in other country:
AfghanistanAlbaniaAlgeriaAndorraAngolaAntigua and BarbudaArab WorldArgentinaArmeniaArubaAustraliaAustriaAzerbaijanBahamas, TheBahrainBangladeshBarbadosBelarusBelgiumBelizeBeninBermudaBhutanBoliviaBosnia and HerzegovinaBotswanaBrazilBritish Virgin IslandsBrunei DarussalamBulgariaBurkina FasoBurundiCabo VerdeCambodiaCameroonCanadaCaribbean small statesCayman IslandsCentral African RepublicCentral Europe and the BalticsChadChileChinaColombiaComorosCongo, Dem. Rep.Congo, Rep.Costa RicaCote d'IvoireCroatiaCubaCuracaoCyprusCzech RepublicDenmarkDjiboutiDominicaDominican RepublicEarly-demographic dividendEast Asia & PacificEast Asia & Pacific (excluding high income)East Asia & Pacific (IDA & IBRD countries)EcuadorEgypt, Arab Rep.El SalvadorEquatorial GuineaEritreaEstoniaEthiopiaEuro areaEurope & Central AsiaEurope & Central Asia (excluding high income)Europe & Central Asia (IDA & IBRD countries)European UnionFijiFinlandFragile and conflict affected situationsFranceGabonGambia, TheGeorgiaGermanyGhanaGibraltarGreeceGrenadaGuatemalaGuineaGuinea-BissauGuyanaHaitiHeavily indebted poor countries (HIPC)High incomeHondurasHong Kong SAR, ChinaHungaryIBRD onlyIcelandIDA & IBRD totalIDA blendIDA onlyIDA totalIndiaIndonesiaIran, Islamic Rep.IraqIrelandIsraelItalyJamaicaJapanJordanKazakhstanKenyaKiribatiKorea, Rep.KuwaitKyrgyz RepublicLao PDRLate-demographic dividendLatin America & Caribbean Latin America & Caribbean (excluding high income)Latin America & the Caribbean (IDA & IBRD countries)LatviaLeast developed countries: UN classificationLebanonLesothoLiberiaLibyaLiechtensteinLithuaniaLow & middle incomeLow incomeLower middle incomeLuxembourgMacao SAR, ChinaMacedonia, FYRMadagascarMalawiMalaysiaMaldivesMaliMaltaMarshall IslandsMauritaniaMauritiusMexicoMiddle East & North AfricaMiddle East & North Africa (excluding high income)Middle East & North Africa (IDA & IBRD countries)Middle incomeMoldovaMonacoMongoliaMoroccoMozambiqueMyanmarNamibiaNauruNepalNetherlandsNew ZealandNicaraguaNigerNigeriaNorth AmericaNorwayOECD membersOmanOther small statesPacific island small statesPakistanPalauPanamaPapua New GuineaParaguayPeruPhilippinesPolandPortugalPost-demographic dividendPre-demographic dividendPuerto RicoQatarRomaniaRussian FederationRwandaSamoaSan MarinoSao Tome and PrincipeSaudi ArabiaSenegalSerbiaSeychellesSierra LeoneSingaporeSlovak RepublicSloveniaSmall statesSolomon IslandsSomaliaSouth AfricaSouth AsiaSouth Asia (IDA & IBRD)SpainSri LankaSt. Kitts and NevisSt. LuciaSt. Vincent and the GrenadinesSub-Saharan Africa Sub-Saharan Africa (excluding high income)Sub-Saharan Africa (IDA & IBRD countries)SudanSurinameSwazilandSwedenSwitzerlandSyrian Arab RepublicTajikistanTanzaniaThailandTimor-LesteTogoTongaTrinidad and TobagoTunisiaTurkeyTurks and Caicos IslandsTuvaluUgandaUkraineUnited Arab EmiratesUnited KingdomUnited StatesUpper middle incomeUruguayVanuatuVenezuela, RBVietnamWest Bank and GazaWorldYemen, Rep.ZambiaZimbabwe Timeline:
This timeline shows a graph from 1971 to 2015 of High income. No data until 1970. Number of actual observations by date: 45.
Source name:
World Development Indicators
Source organization:
UNESCO Institute for Statistics
Categories, topics:
Education
Last updated:
apr 23, 2017
Indicators value changes by year
Minimum:
10.013
jan 1, 1992
Maximum:
12.971
jan 1, 1972
At the date of observation
Value
Absolute change
Change from previous value
jan 1, 1971
12.932
+12.932
0.0%
jan 1, 1972
12.971
+0.039
0.3%
jan 1, 1973
12.698
-0.273
-2.11%
jan 1, 1974
12.415
-0.283
-2.23%
jan 1, 1975
12.662
+0.247
1.99%
jan 1, 1976
12.764
+0.102
0.81%
jan 1, 1977
12.834
+0.07
0.55%
jan 1, 1978
12.533
-0.301
-2.34%
jan 1, 1979
12.234
-0.299
-2.39%
jan 1, 1980
11.928
-0.306
-2.5%
jan 1, 1981
11.695
-0.234
-1.96%
jan 1, 1982
11.415
-0.28
-2.39%
jan 1, 1983
11.141
-0.274
-2.4%
jan 1, 1984
10.863
-0.278
-2.49%
jan 1, 1985
10.579
-0.284
-2.61%
jan 1, 1986
10.39
-0.189
-1.79%
jan 1, 1987
10.192
-0.198
-1.9%
jan 1, 1988
10.137
-0.055
-0.54%
jan 1, 1989
10.212
+0.074
0.73%
jan 1, 1990
10.362
+0.151
1.47%
jan 1, 1991
10.478
+0.115
1.11%
jan 1, 1992
10.013
-0.465
-4.44%
jan 1, 1993
10.022
+0.01
0.1%
jan 1, 1994
10.11
+0.088
0.88%
jan 1, 1995
10.097
-0.013
-0.13%
jan 1, 1996
10.797
+0.7
6.93%
jan 1, 1997
10.957
+0.16
1.48%
jan 1, 1998
10.986
+0.03
0.27%
jan 1, 1999
10.996
+0.01
0.09%
jan 1, 2000
10.975
-0.021
-0.19%
jan 1, 2001
10.962
-0.013
-0.12%
jan 1, 2002
10.964
+0.002
0.02%
jan 1, 2003
10.602
-0.362
-3.3%
jan 1, 2004
10.751
+0.149
1.4%
jan 1, 2005
10.671
-0.079
-0.74%
jan 1, 2006
10.745
+0.073
0.69%
jan 1, 2007
10.695
-0.05
-0.47%
jan 1, 2008
10.853
+0.158
1.48%
jan 1, 2009
10.809
-0.044
-0.4%
jan 1, 2010
10.986
+0.176
1.63%
jan 1, 2011
10.907
-0.079
-0.72%
jan 1, 2012
10.933
+0.026
0.24%
jan 1, 2013
11.125
+0.192
1.75%
jan 1, 2014
11.399
+0.275
2.47%
jan 1, 2015
11.649
+0.25
2.19%
Ranking of countries by current statistics by years


Comments: