30
/
AIzaSyAYiBZKx7MnpbEhh9jyipgxe19OcubqV5w
April 1, 2024
203371
Mozambique
MOZ
true
2
1
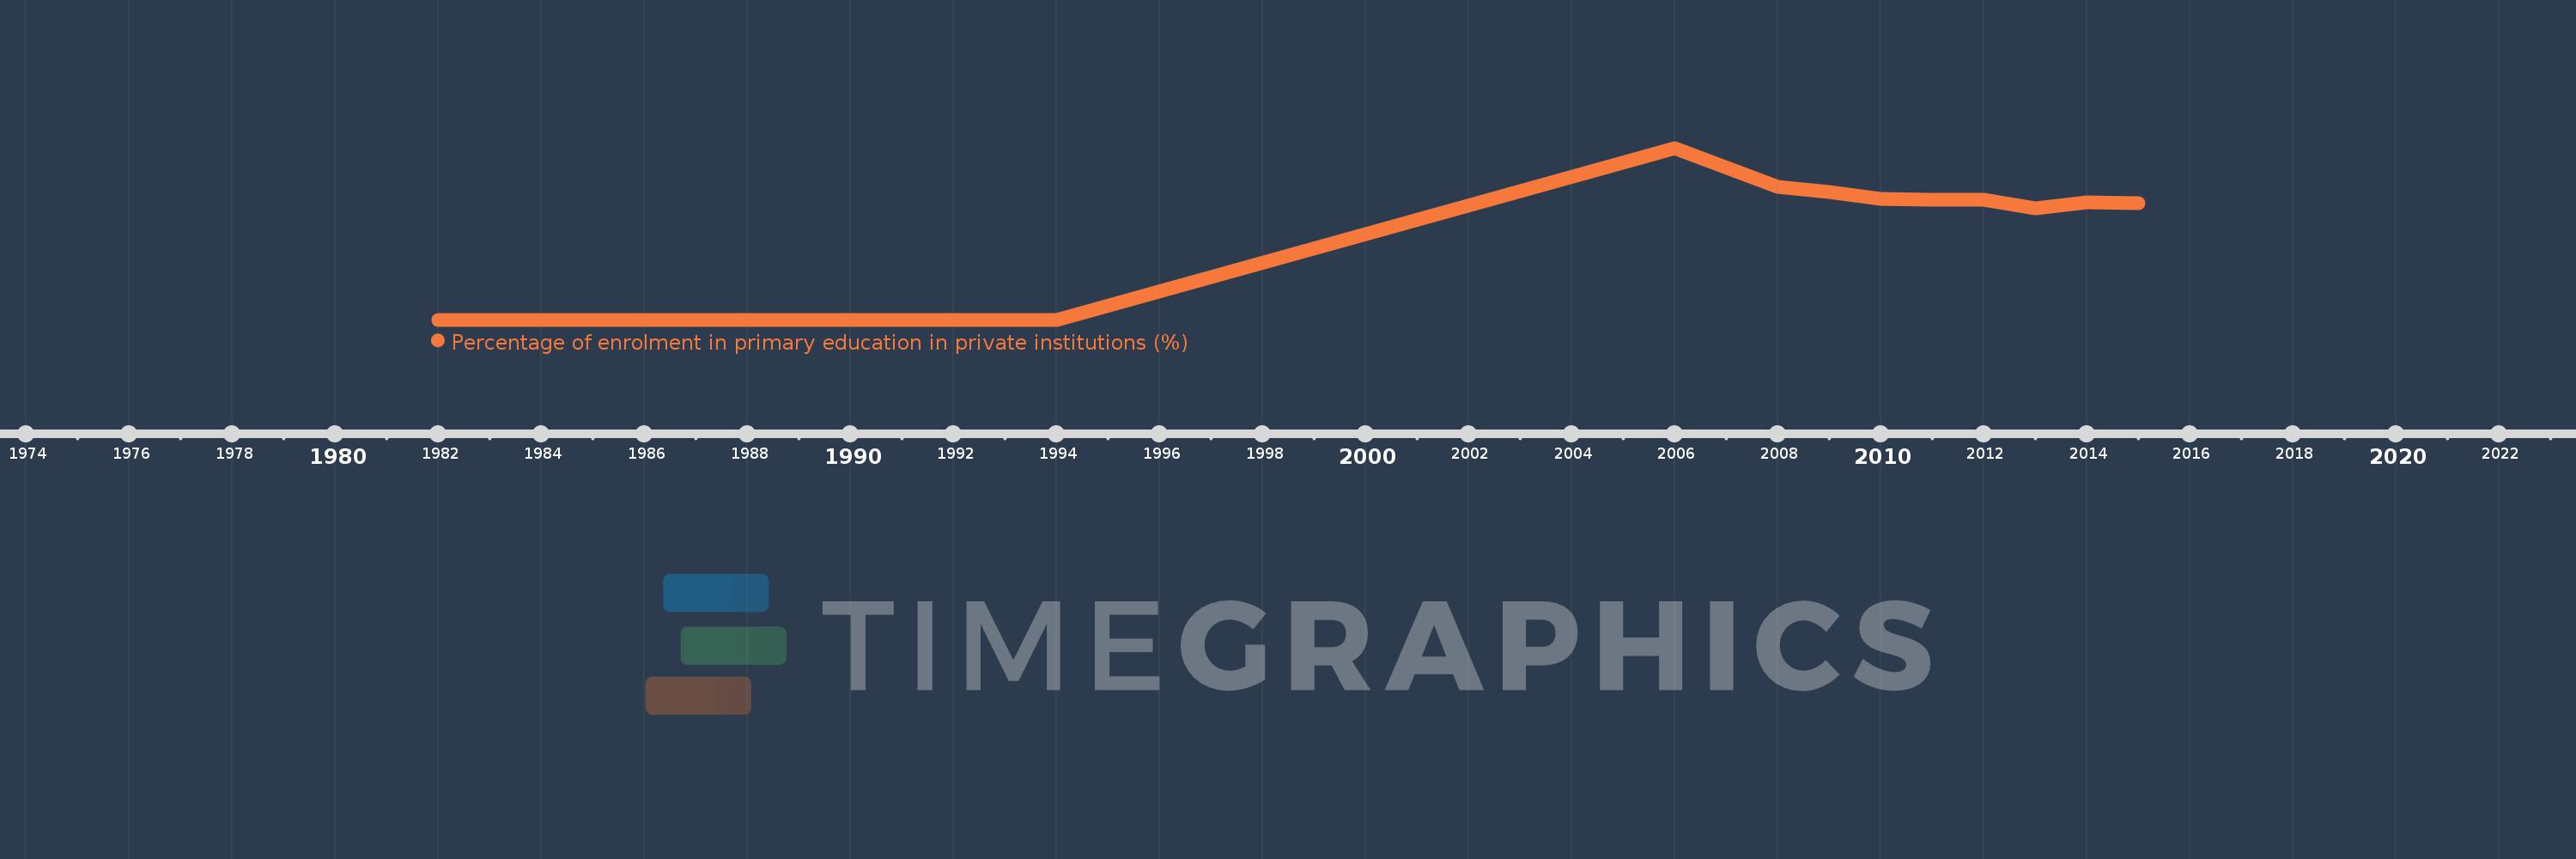
Percentage of enrolment in primary education in private institutions (%)
2015,2014,2013,2012,2011,2010,2009,2008,2006,1994,1993,1992,1991,1990,1989,1988,1987,1986,1984,1983,1982
